
The Legends of Runeterra CI/CD Pipeline
Hi, I’m Guy Kisel, and I’m a software engineer on Legends of Runeterra’s Production Engineering: Shared Tools, Automation, and Build team (PE:STAB for short). My team is responsible for solving cross-team shared client technology issues and increasing development efficiency. We focus on the areas that empower other teams to do more and protect the team from emergent issues that distract from developing new features. You might recognize me from my past articles about automated testing and using Perforce in Jenkins.
In this article I’m going to share some details about how we build, test, and deploy Legends of Runeterra, a digital collectible card game.
Let’s start with some basic info about our tools and workflows.
- Tools:
- Game engine: Unity (just recently updated to use Unity 2020)
- Version control: a Git LFS monorepo in GitHub Enterprise using Artifactory as our LFS repository.
- This monorepo contains all of our game client code, game server code, game assets, build scripts, and most of our tools.
- We have a separate monorepo for our microservices. Yes, this means our use of the term “monorepo” is a little questionable.
- Issue tracking: JIRA
- Metrics, monitoring, alerting: New Relic
- Communication, build status notifications, and our internal support workflow: Slack
- More on this in How Riot Games Uses Slack.
- CI/CD: Jenkins
- We use Jenkins Scripted Pipelines with several internal shared pipeline libraries.
- We try to do most of our complex build logic in Python per Jenkins pipeline best practices to use Groovy mostly as glue.
- Development infrastructure: mostly AWS. Some of the internal services we depend on run in Riot’s own data centers.
- 100 x t3.2xlarge Windows build nodes
- 5 x m4.2xlarge Ubuntu build nodes
- 2 x mac1.metal macOS build nodes
- 1 x m5.8xlarge Jenkins main server
- 8 x m5.4xlarge Docker swarm nodes
- Workflow:
- Supported platforms: Windows, Android, and iOS.
- We support crossplay, which adds extra complexity to our release pipeline, but it provides a lot of player value.
- Public release cadence: every few weeks, with hotfixes along the way as needed
- Branching strategy: a hierarchical branching strategy sort of related to Git flow. More on this later.
- Supported platforms: Windows, Android, and iOS.
- Quick stats
- ~100 runs per day of the full CI/CD pipeline (2-3k builds per month)
- ~60 minute average pipeline run time
- ~700 Git branches
- ~270k commits
- LoR monorepo is ~100 GB and ~1,000,000 files
- Over a hundred really talented engineers, artists, designers, writers, and more!
The goal of this post is not to provide comprehensive documentation on our pipeline and tools - instead, I hope to walk you through several technical challenges we faced while developing and maintaining our CI/CD pipeline.
Special note: LoR went through a lot of iterations during its development process under the codename “Bacon” and this is still widely used across our tools and source code. You’ll see it several times in this article. Choose your project codenames carefully, they tend to stick around for a long time.
Enabling Safe Iteration in Parallel
Challenge: The High Cost of Failed Builds + Tests
Most game teams at Riot use Perforce with trunk-based workflows. This means when you’re done with a feature or other change, you just commit it directly to the main branch. In these workflows most of your iteration loop happens locally because the cost of a commit that fails builds or tests is high - it blocks everyone else.
Early in LoR’s development (before I joined the project!), LoR also used Perforce. However - at least back then - there were some pain points with Unity’s Perforce integration, and the team also wanted better CI/CD capabilities for changes that haven’t made it to the main branch yet. This led to the team switching to Git.
Solution: Hierarchical Branch-Based Workflow
LoR’s solution is a hierarchical branch-based workflow.
Developers work in feature branches off shared team branches. When they’re done with a feature, they open a pull request to their team branch. Developers used to branch directly off the main branch, but we found we were breaking our main branch build too often. Using shared branches for each team allows for more testing time prior to merge to main.
On a regular basis, shared team branches get merged into the main branch.
Once a day, an auto-merge job runs to merge each parent branch into its children.
For each release, we cut a release branch off the main branch.
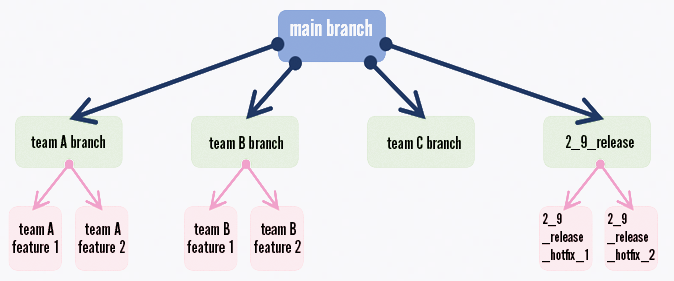
LoR’s branch strategy represented visually
For each branch, we track some metadata:
- The parent branch
- The associated JIRA ticket
- Branch owners (usually just the developer working in the branch)
- Test environment configurations for the branch
  "lor_94288_get_unity_builds_work": {
        "baseBranch": "main",
        "jiraTickets": [
            "LOR-94288"
        ],
        "owners": [
            "gkisel"
        ],
        "region": "LAX",
        "shouldAutoMerge": true,
        "type": "feature"
    },
    ...
        "lor_94288_get_unity_builds_work": {
        "branch": "lor_94288_get_unity_builds_work",
        "build_type": "dev",
        "gameVersion": "Soon",
        "node_tier": "bronze",
        "owners": [
            "gkisel"
        ]
},LoR's previous workflow used a static set of test environments that functioned as shared sandboxes. This made iteration difficult because it was easy to accidentally interfere with someone else’s testing.
Now, we actually create new test environments as needed for each branch, which provides developers with isolated sandboxes to safely experiment in. These test environments can all be installed by any developer from our internal client.
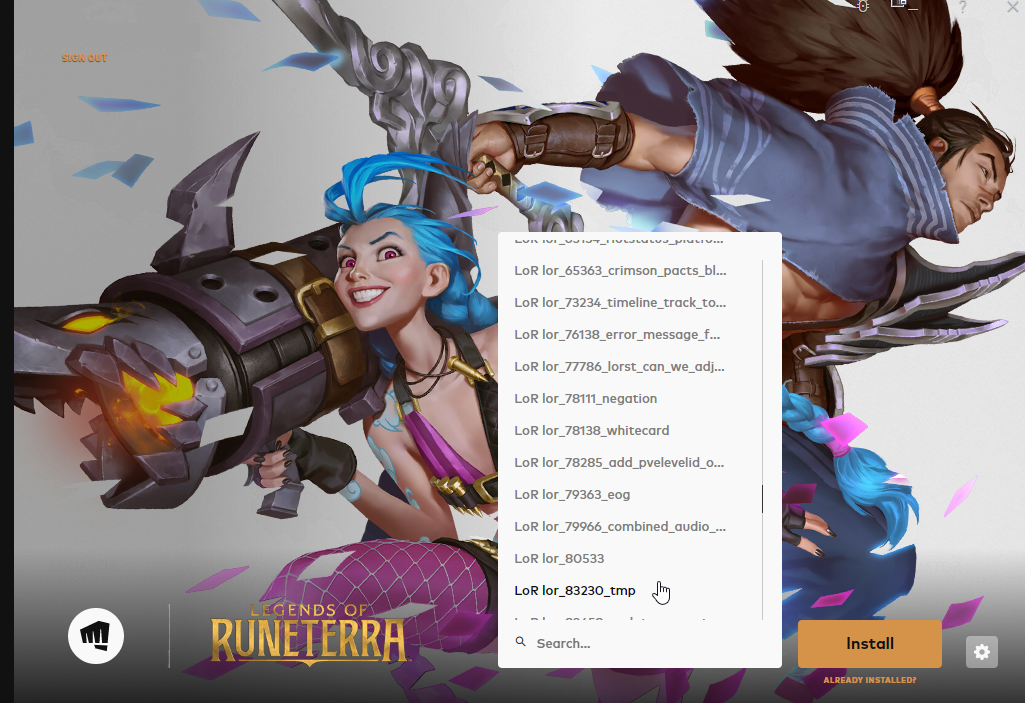
From our internal client you can select from test environments providing builds for different Git branches/JIRA tickets
We have some cool optimizations for this - for example, we used to deploy a new game server for each and every test environment, but this resulted in so many game servers that we were breaking our development clusters. Now we reuse each game server to host the game data for multiple different test environments.
Because we’re using Jenkins multi-branch pipelines, each branch also gets its own full featured CI/CD pipeline. This helps ensure that changes can pass the full pipeline, including automated tests, before they ever get merged.
Our pipeline is an all-in-one build, test, and deploy. In one run of the pipeline, we can build game artifacts for all three supported platforms and multiple different game versions, run all sorts of validation, run our functional and performance automated tests (more on this later), and deploy to test environments for manual testing.
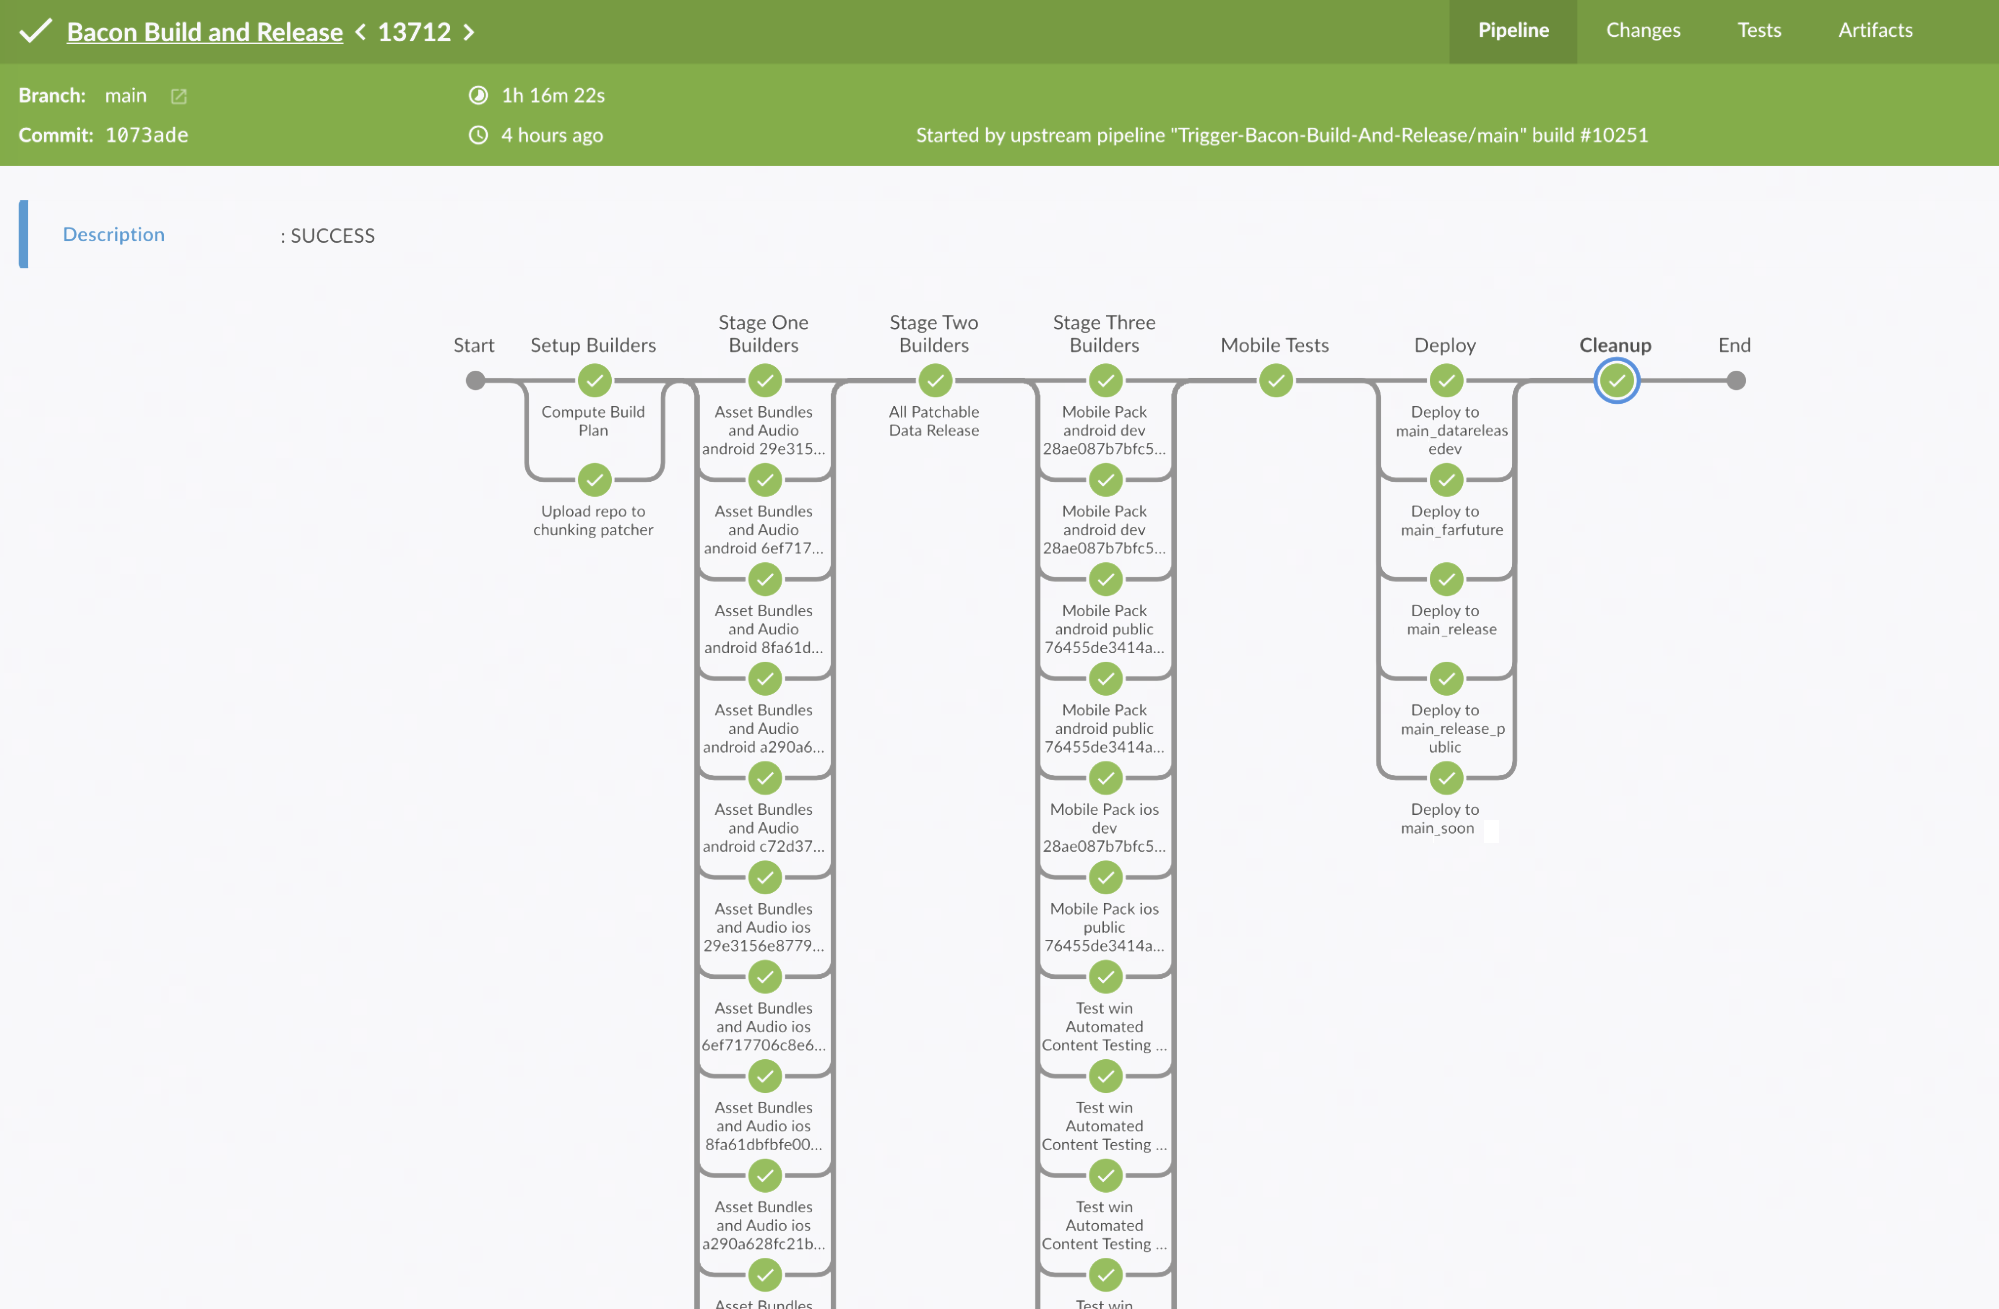
Jenkins Blue Ocean view of a run of our pipeline for our main branch
Our workflow does result in a lot of branches and test environments, so we have an automated branch cleanup job. Each branch has an associated JIRA ticket, and when the JIRA ticket is closed, we delete the branch and any related test environments automatically.
Working Around Slow Processes
Challenge: A Slow Pipeline
Unfortunately, it can take over an hour for a change to progress through our full pipeline. This is something we definitely want to resolve, as it ends up taking our engineers out of their flow state while they either wait for the results, or switch context to work on a different problem. To make sure we're being as efficient as possible, we've made some optimizations.
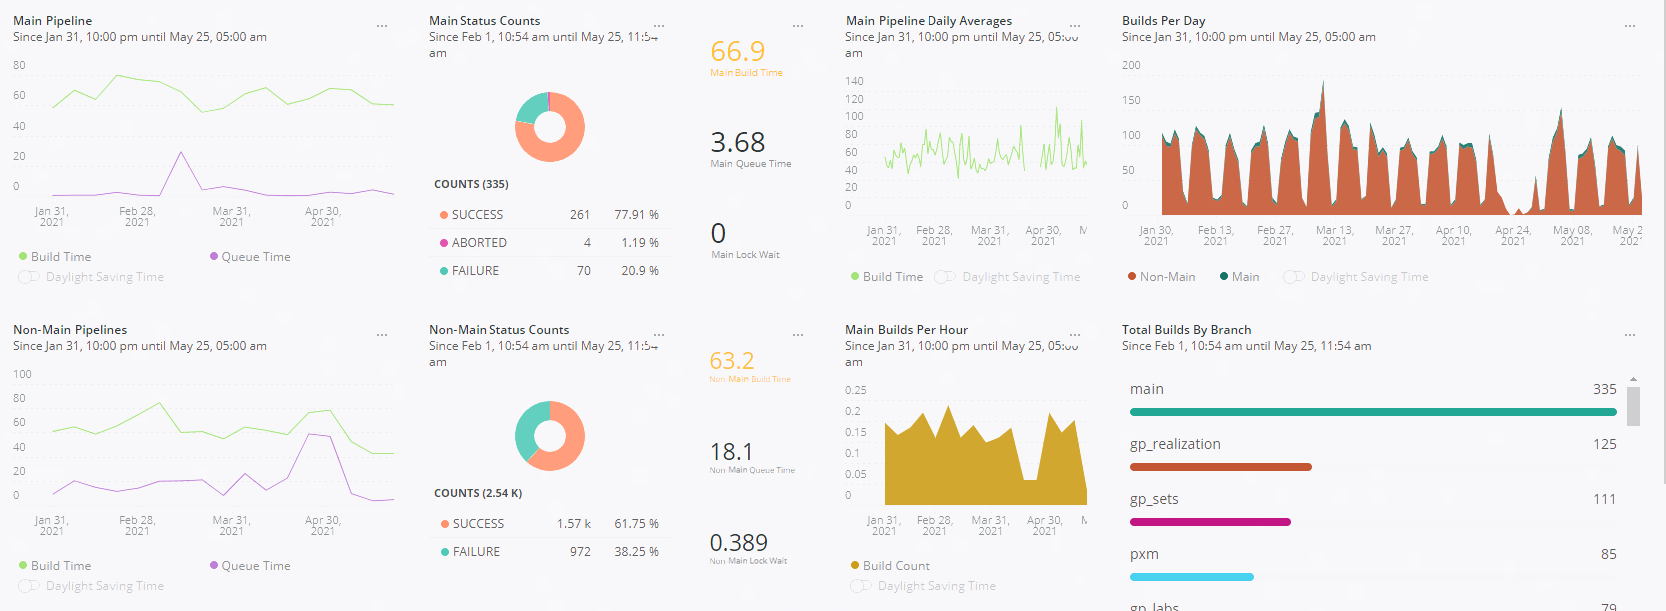
One of our CI/CD metrics dashboards in New Relic. We track detailed pipeline metrics to keep an eye on current and historical build health and pipeline performance.
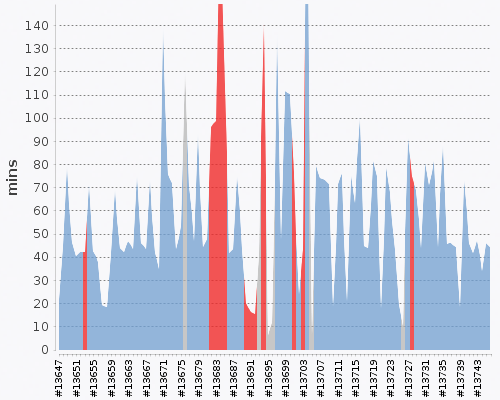
Jenkins build time/health timeline for our main branch
Solution: Optimizing for Speed and Quality
Computing a Build Plan
The simplest version of a build pipeline builds every artifact every time. However, some of our artifacts take a long time and a lot of resources to build. Many of the artifacts also don’t change from commit to commit or branch to branch - for example, if an artist changes some images, there’s no need to rebuild our audio files. To save time, at the start of the build, we compute hashes for the artifacts to see what has actually changed. The result is a JSON file that lists all of the artifacts in a given build, their hashes, and whether any of those hashes are dirty, indicating the artifact needs to be built. This is similar to Bazel’s Remote Caching (I sometimes dream about porting our pipeline to Bazel).
...
  "builds": {
    "assetBundleBuilds": [
      {
        "assetListHash": "14c9d3f451242d57",
        "audioHash": "defaaae7f9b6526c87a438a0a2e9b955",
        "buildAssets": true,
        "buildFilteredLocAudio": true,
        "buildNonLocAudio": true,
        "buildReason": "none",
        "clientAssetHash": "29e3156e87797296f699aad9834925c3",
        "gameVersion": "DataReleaseDev",
        "localizedAudioReleaseId": "C3C1C88E71EA7CE1",
        "patchPrepInfoHash": "450b3058d9996029",
        "platform": "win",
        "soundEventListHash": "b2196afaa1181e19"
      },
...
    "dataMapperBuilds": [
      {
        "buildReason": "dirty",
        "clientGamePlayDataHash": "73615b89d5635391",
        "clientHash": "28ae087b7bfc5e0df6d97a24de3e299e",
        "gameVersion": "DataReleaseDev",
        "serverGamePlayDataHash": "72f53abddf46d7e4"
      },
      {
        "buildReason": "dirty",
        "clientGamePlayDataHash": "3c32f5b9b50fd49c",
        "clientHash": "28ae087b7bfc5e0df6d97a24de3e299e",
        "gameVersion": "FarFuture",
        "serverGamePlayDataHash": "cf2d7e5a1289eef8"
      },
...
Iteration Builds vs Merge Readiness Builds
A full build, including all assets and game clients for three different platforms and potentially several game versions (the currently shipping content plus different sets of work-in-progress future content), game servers, validation steps, and deploys can consume a lot of build farm resources and take over an hour to run. When a developer just wants to iterate on a single feature and maybe do some playtests, they might only need Windows builds for just a single game version, and they might not care that much yet about breaking other features, especially if they’re just experimenting.
To make this quicker and less painful, we introduced a concept we call Iteration builds, where the pipeline just builds a single platform and skips all extra validation steps, and renamed our full build to Merge Readiness to indicate devs must run a Merge Readiness build prior to merge. Even if an Iteration build succeeds, the GitHub commit status still gets set as a failure to encourage developers to make sure they run a Merge Readiness build.

GitHub commit status for an Iteration build
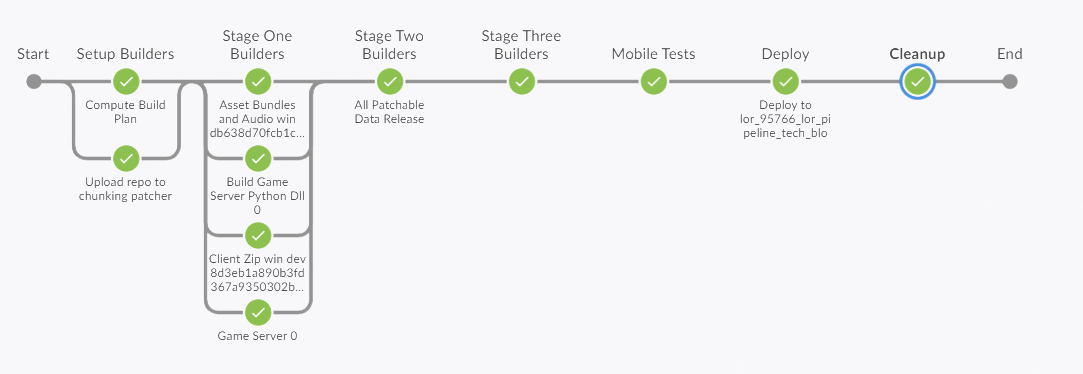
Jenkins Blue Ocean view for an Iteration build
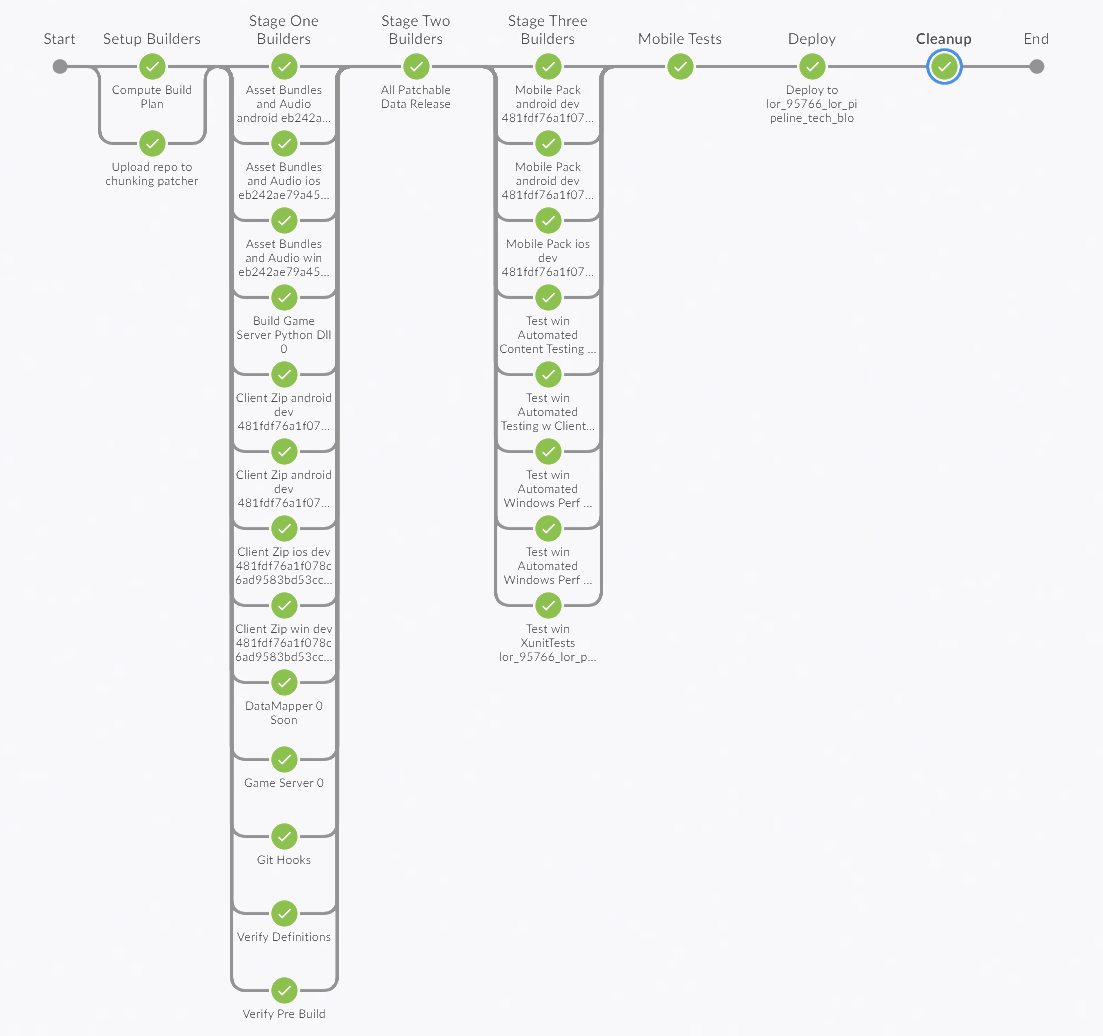
Jenkins Blue Ocean view for a Merge Readiness build on the same branch as above. Note the additional validation steps.
Git LFS Slow on Windows
A full clone of our game monorepo is about a hundred gigabytes and nearly a million files. Given a pre-existing workspace on a build node, a Git (plus LFS) sync takes one to two minutes (in Windows, for a t3.2xlarge AWS instance). This is pretty fast, but it could be even faster!
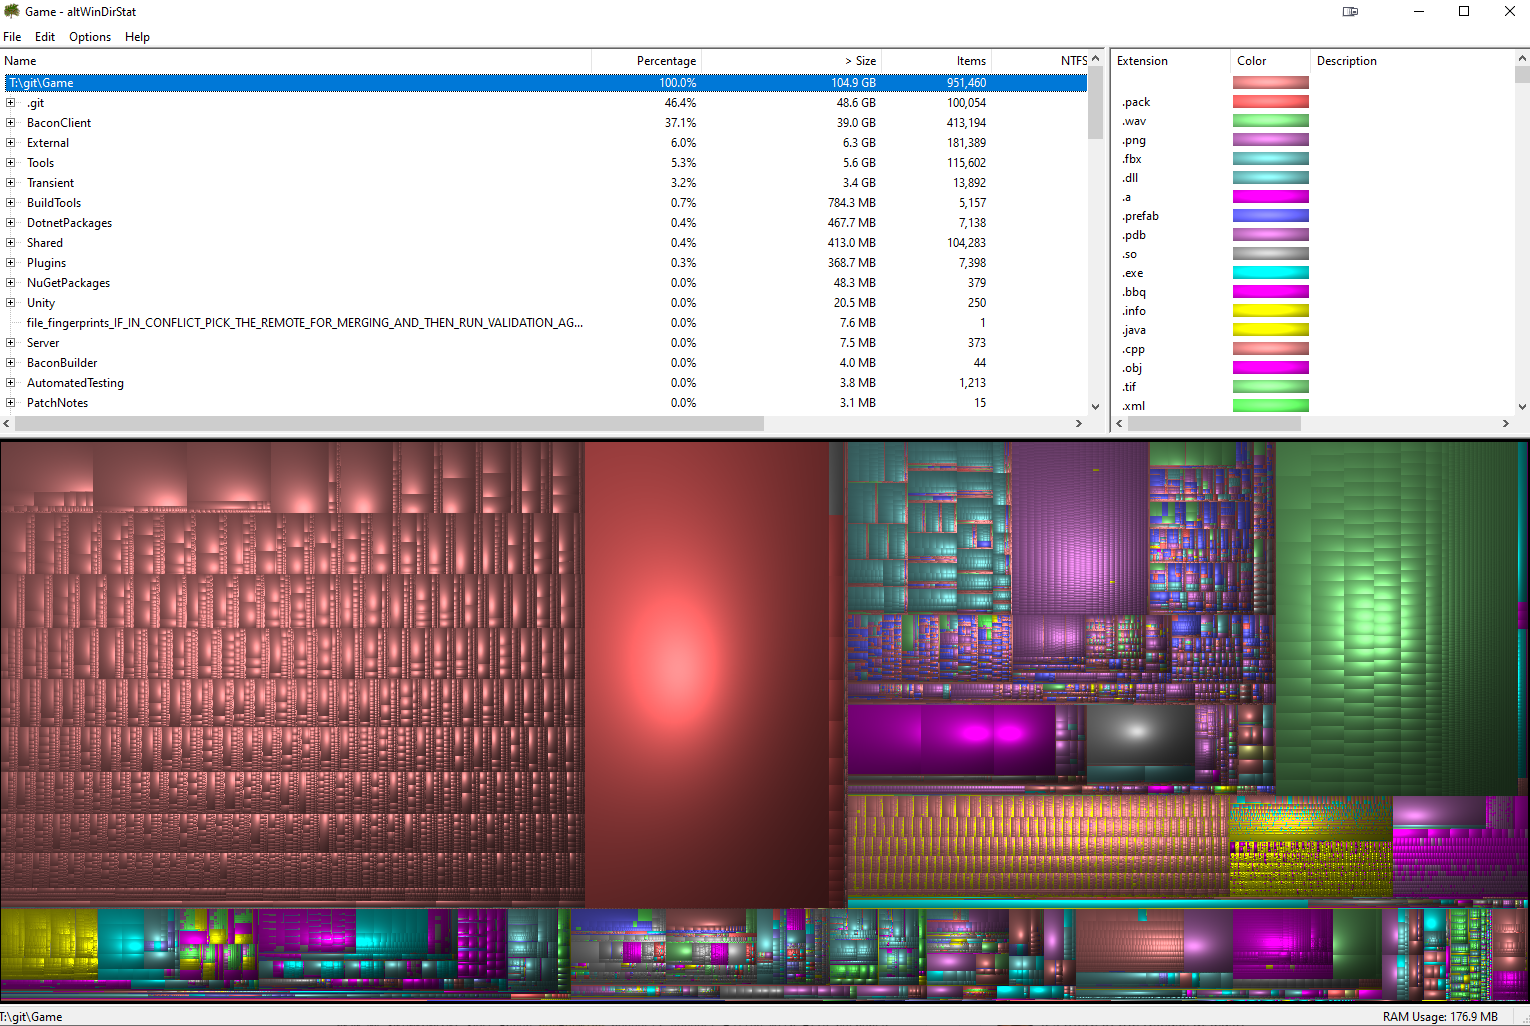
A look at our monorepo using altWinDirStat
Why is our repo so big? Video games have a lot of assets - art, sound effects, etc. To simplify developer environment setup, we’ve also vendored most of our tools. For example, we’ve vendored Python binaries for Windows, macOS, and Linux, along with all of our Python dependencies. Instead of needing to install a bunch of tools, devs just sync the repo and have everything immediately available.
Our pipeline contains many separate steps, each of which can run on a different build node. Each of these steps needs a workspace with our Git repo. We maintain persistent workspaces on long-lived build VMs that already have the repo checked out for speed (we’d like to eventually move to ephemeral build nodes that mount volumes that already contain our repo, but of course this is yet more complexity in an already complex system).
Even so, on Windows we were experiencing slow Git LFS syncs. To save time, at the start of each build, in parallel with computing our build plan, we sync the repo to a workspace and then upload the entire repo (minus the .git directory) to the same chunking patcher we use for distributing our games.


Repo upload to the patcher
In all subsequent steps of the pipeline, we use the patcher to sync our workspaces. We benefit from this in two ways. First, because we’re not doing any Git bookkeeping and we’re not copying the .git directory, we don’t get the performance hit from updating Git metadata. Second, the patcher is fast, and because it copies data from a CDN, we don’t need to worry about accidentally DDOSing our Artifactory LFS repo from running too many parallel builds.
You might wonder why we don’t just use rsync or something similar for this instead of our patcher. There are a few reasons:
-
The patcher is well-optimized on Windows.
-
rsync might overload the source machine if we’re syncing to multiple machines at the same time, while the patcher syncs from a very scalable CDN.
-
The patcher has advanced features, like release metadata that lets us fetch particular versions of the repo.
Using the patcher, our sync times for a pre-existing workspace drop to about ten to fifteen seconds, which is a nice improvement over the one to two minutes it takes with Git, especially when we’re doing up to a few dozen workspace syncs per run of the pipeline.
Note that in the rare cases we need to sync a fresh empty workspace, even with the patcher it still takes quite a long time, because it’s simply a lot of data to move.
We’ve also started moving our vendored tools from Git LFS directly into the patcher. For some of our larger tools, like Unity itself, we upload the entire tool to the patcher, and then in the repo we have a dependency downloader script plus pointer files listing the latest patcher release ID for each tool. When I launch Unity on my work PC, it actually first runs the downloader script to see if there’s a newer version available. This is especially helpful for remote work - it’s much faster to pull down tools from a CDN than to try to download them over a VPN.
Simplifying and Accelerating the Testing Process
Challenge: Video Game Testing is Difficult and Time-Consuming
Our automated validation in CI includes:
- Static analysis
- Rerunning Git pre-commit hooks to make sure people didn’t skip them locally
- Asset validation (for example all images must be square PNGs with power-of-two resolutions)
- C# Xunit tests
- Automated performance tests to ensure we don’t go over our mobile memory budget
- Automated functional tests (using pytest) that can test game servers on their own (LoR is game-server authoritative) or clients + game servers (we usually run the clients headless in functional tests for faster testing)
Solution: Built-In QA Tooling
To enable our automated tests, debug builds of the game include an HTTP server that provides direct control of the game, including a bunch of handy cheats and dev-only test cards. By controlling the game directly through HTTP calls, we avoid brittle UI-based testing. Instead of trying to write tests that click buttons, we can just tell the game to play a card, attack, concede, etc. We use pytest to create test cases for much of our game logic.
For our functional tests we normally run either just a game server on its own or a headless game client in a VM. For convenience, we launch the test game servers in the same docker swarm we use for running containerized build steps. For performance tests, we run headed on bare metal to ensure realistic results. To improve test speed, we reuse a single game server for each set of tests. The game server is designed to host many concurrent matches anyway, so hosting many concurrent tests is no problem, and this is much faster than launching a new game server for each test case. We can run several hundred functional tests in just a few minutes by running the game at 10x speed and parallelizing our tests.

def test_hecarim_level_one(server, clients):
    """
    test that hecarim summons 2 spectral riders on attack
    """
    player_one, player_two, *_ = clients

    game_id = player_one.enter_game()
    player_two.enter_game(game_id)

    player_one.accept_hand()
    player_two.accept_hand()

    server.clear_all_cards(game_id)
    server.set_turn_timer(game_id, False)
    server.unlock_base_mana(game_id, 0)

    hecarim = server.create_card_by_card_code(player_one, "01SI042", RegionType.BackRow)[0]
    player_one.attack(hecarim)
    player_one.submit()
    cards_in_attack = card_helper.get_cards_in_region(player_one, RegionType.Attack)
    assert len(cards_in_attack) == 3
    assert card_helper.check_card_code(player_one, cards_in_attack[1], "01SI024")
assert card_helper.check_card_code(player_one, cards_in_attack[2], "01SI024")A video demonstration of our tests running
Technical Tools for Non-Technical Devs
Challenge: Non-Technical Folks Using Git
Version control is hard. Git is hard. I’ve been using Git for years as a software engineer and I still make mistakes all the time. For game designers, artists, and other folks who are probably only using Git because we’re forcing them to use it, Git can be intimidating, unfriendly, and unforgiving. We used to have people use various Git GUI clients, since a GUI can be a bit more user friendly than the Git CLI, but even the most user friendly Git GUIs are meant for general purpose software development and have feature-rich user interfaces with a lot of buttons and options that can be overwhelming.
Solution: Custom GUI Tool To Reduce User-Facing Complexity
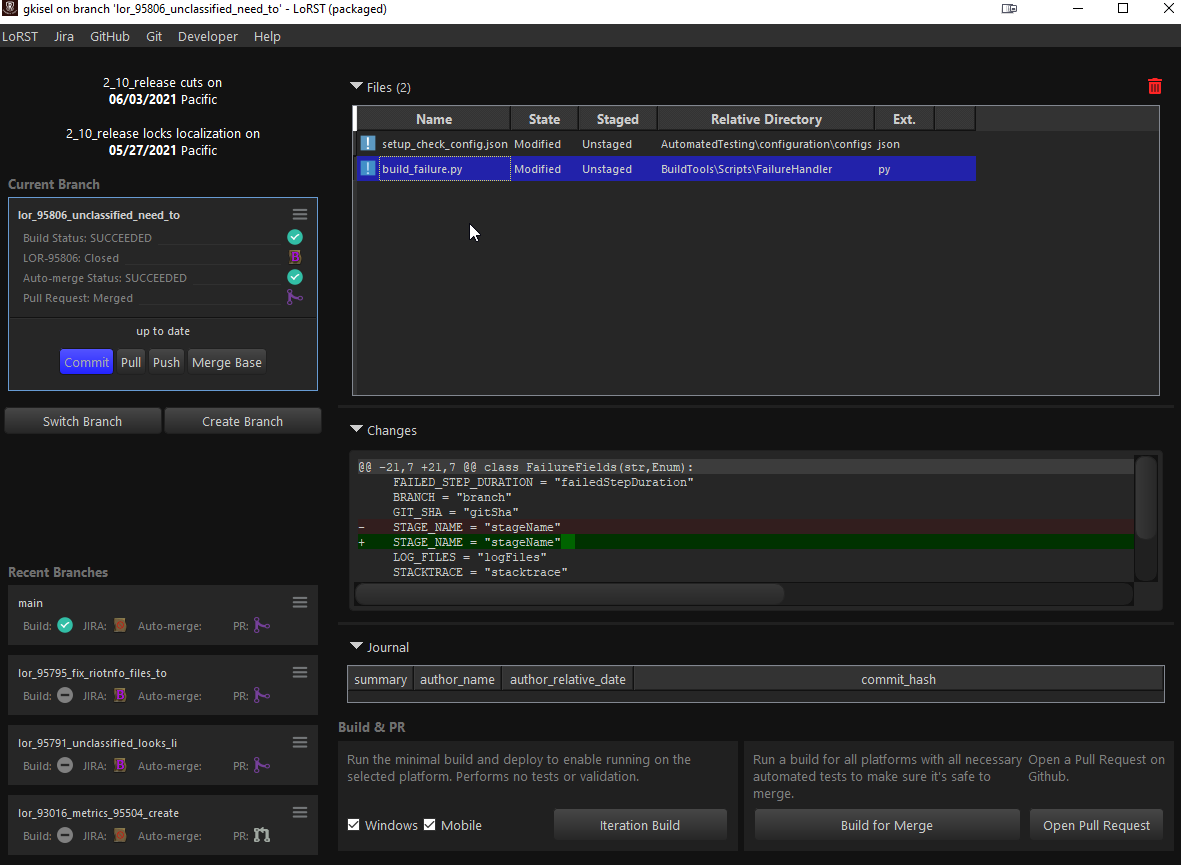
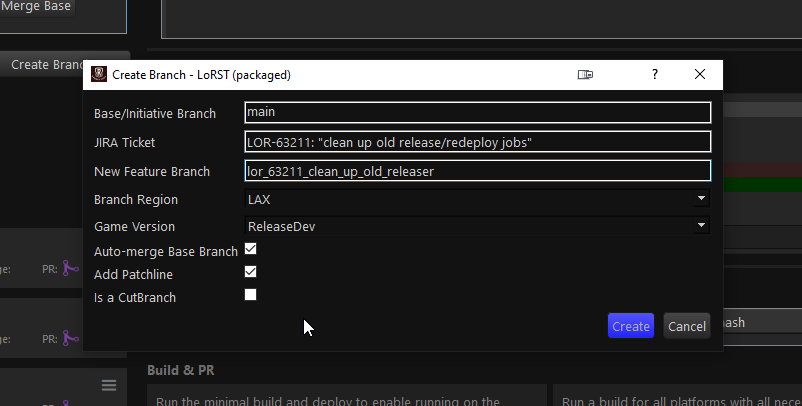
To improve our LoR developer user experience, we built a custom GUI tool just for LoR (inspired by a similar tool created for LoL) that’s specialized for our workflow. Because our tool is narrowly scoped to just one project and one repo, we can make a lot of assumptions that reduce user-facing complexity. Additionally, we’ve integrated our Git workflow with our JIRA and Jenkins workflows. We call this tool LoRST (Legends of Runeterra Submit Tool). It’s built using Python with PySide2.
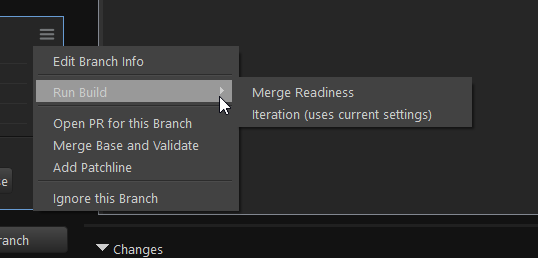
From this one tool, LoR devs can create new branches (complete with test environments, build jobs, JIRA tickets, and auto-merge configurations), commit and push changes, trigger Iteration builds and Merge Readiness builds, open pull requests, and resolve most merge conflicts.
Clear and Concise Failure Debugging
Challenge: Complicated Pipelines Can Fail in Confusing Ways
Our pipeline has dozens of steps, each of which could fail in a wide variety of ways. Understanding how and why a build failed can be difficult. The pipeline depends on about fifty different services, such as Sentry, AWS, and various internal tools. If any of these fail, our pipeline could fail. Even if all these services work perfectly, a mistake by a developer could still cause a failure. Providing useful build failure feedback is critical to helping the team work efficiently.

Solution: Build Failure Notifications
We’ve gone through several iterations of build failure notifications in an attempt to provide better failure feedback. Our first attempt was to redirect stderr from our Python scripts to a temporary text file. If the script failed, we’d dump the stderr text file into the failure notification. This sometimes provided useful info, but only if the Python script had effective logging. Our next attempt was to use the Jenkins Build Failure Analyzer plugin, which uses regular expressions to match known failure causes against logs.
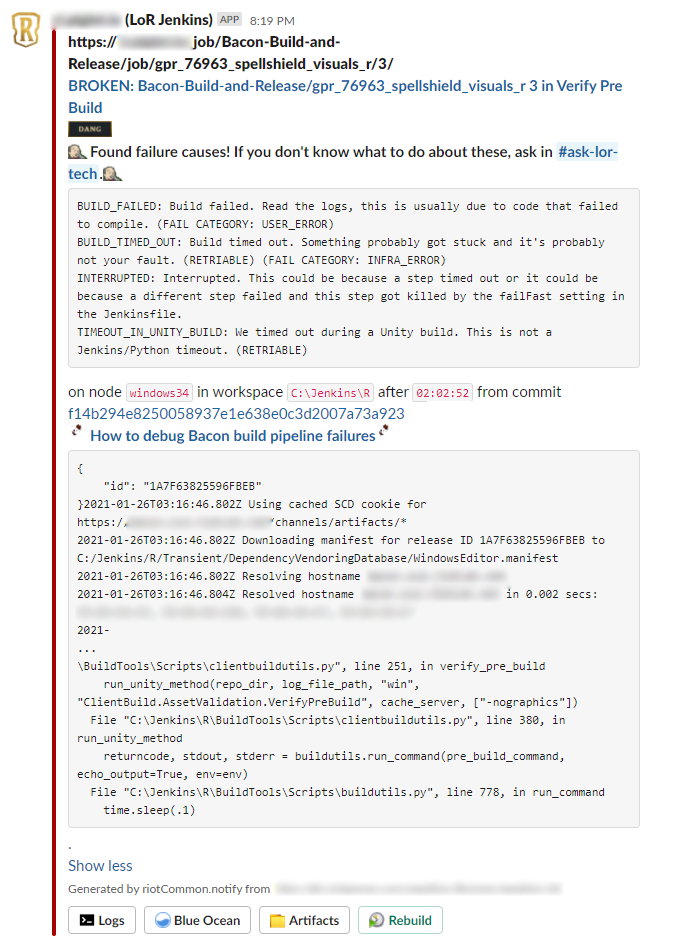
Our older build notifications. A bit overwhelming.
The BFA plugin has some limitations - log scanning runs on the central Jenkins server, which can be a significant performance hit. The plugin also only scans the build’s console logs, but some of our tools output extremely verbose logs that we usually redirect to separate text files. I wrote a Python log scanner script that runs in our Jenkins Docker swarm to download all log files from a given build and scan them all. This solved the performance issue and the console log issue.
The Python log scanner still had a significant false positive rate which resulted in ambiguous or confusing failure notifications. It also stored all the failure causes as a large JSON file in a central location. Gabriel Preston, an engineering manager on the Riot Developer Experience: Continuous Service Delivery team, set up a conversation with Utsav Shah, one of his former teammates at Dropbox, where they had built their own sophisticated build failure analysis system. Utsav mentioned that for each failure, they created and saved a JSON file with metadata about the failure for later analysis. Inspired by this system, we redesigned our failure analysis to define failures right where they happen in our build scripts, which makes failures more maintainable and understandable and reduces the false positive rate. It also means we don’t usually need to do any log scanning. When something fails, we create a JSON file with failure metadata, and then later capture the failure JSON file to send telemetry to New Relic as well as a Slack notification.
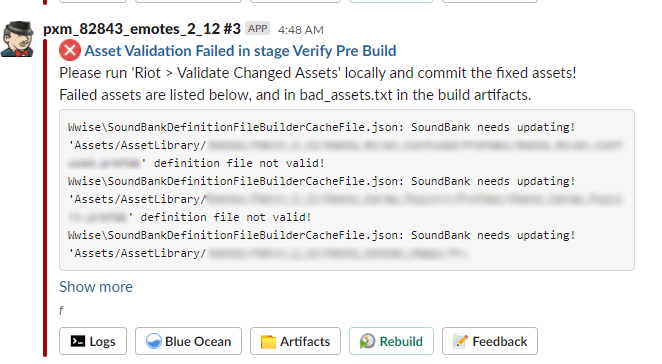
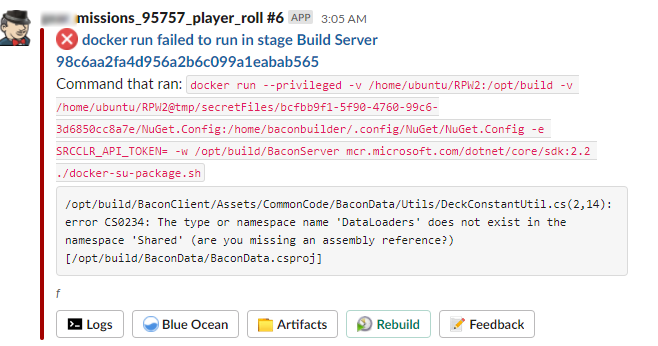
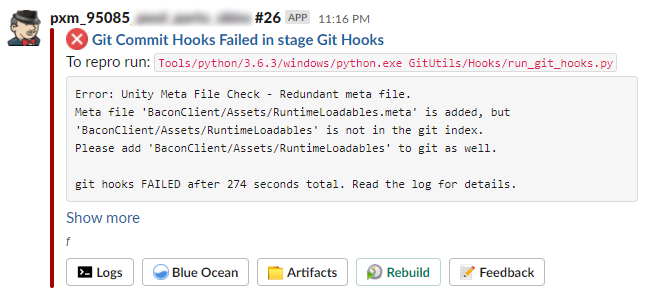
A few of our newer failure notifications. Much more concise.
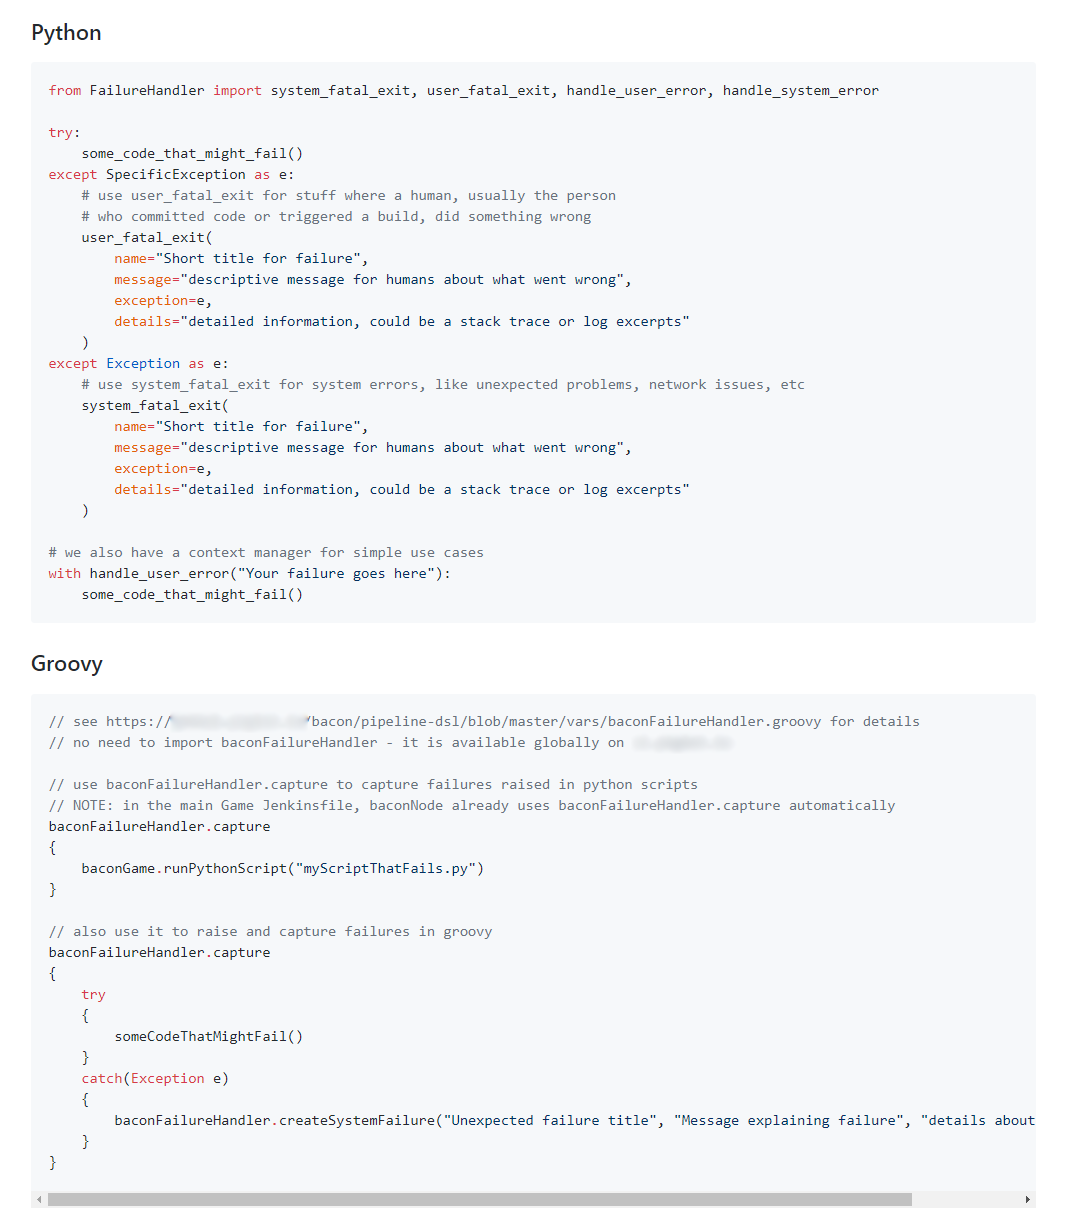
Failure handler usage examples from our readme
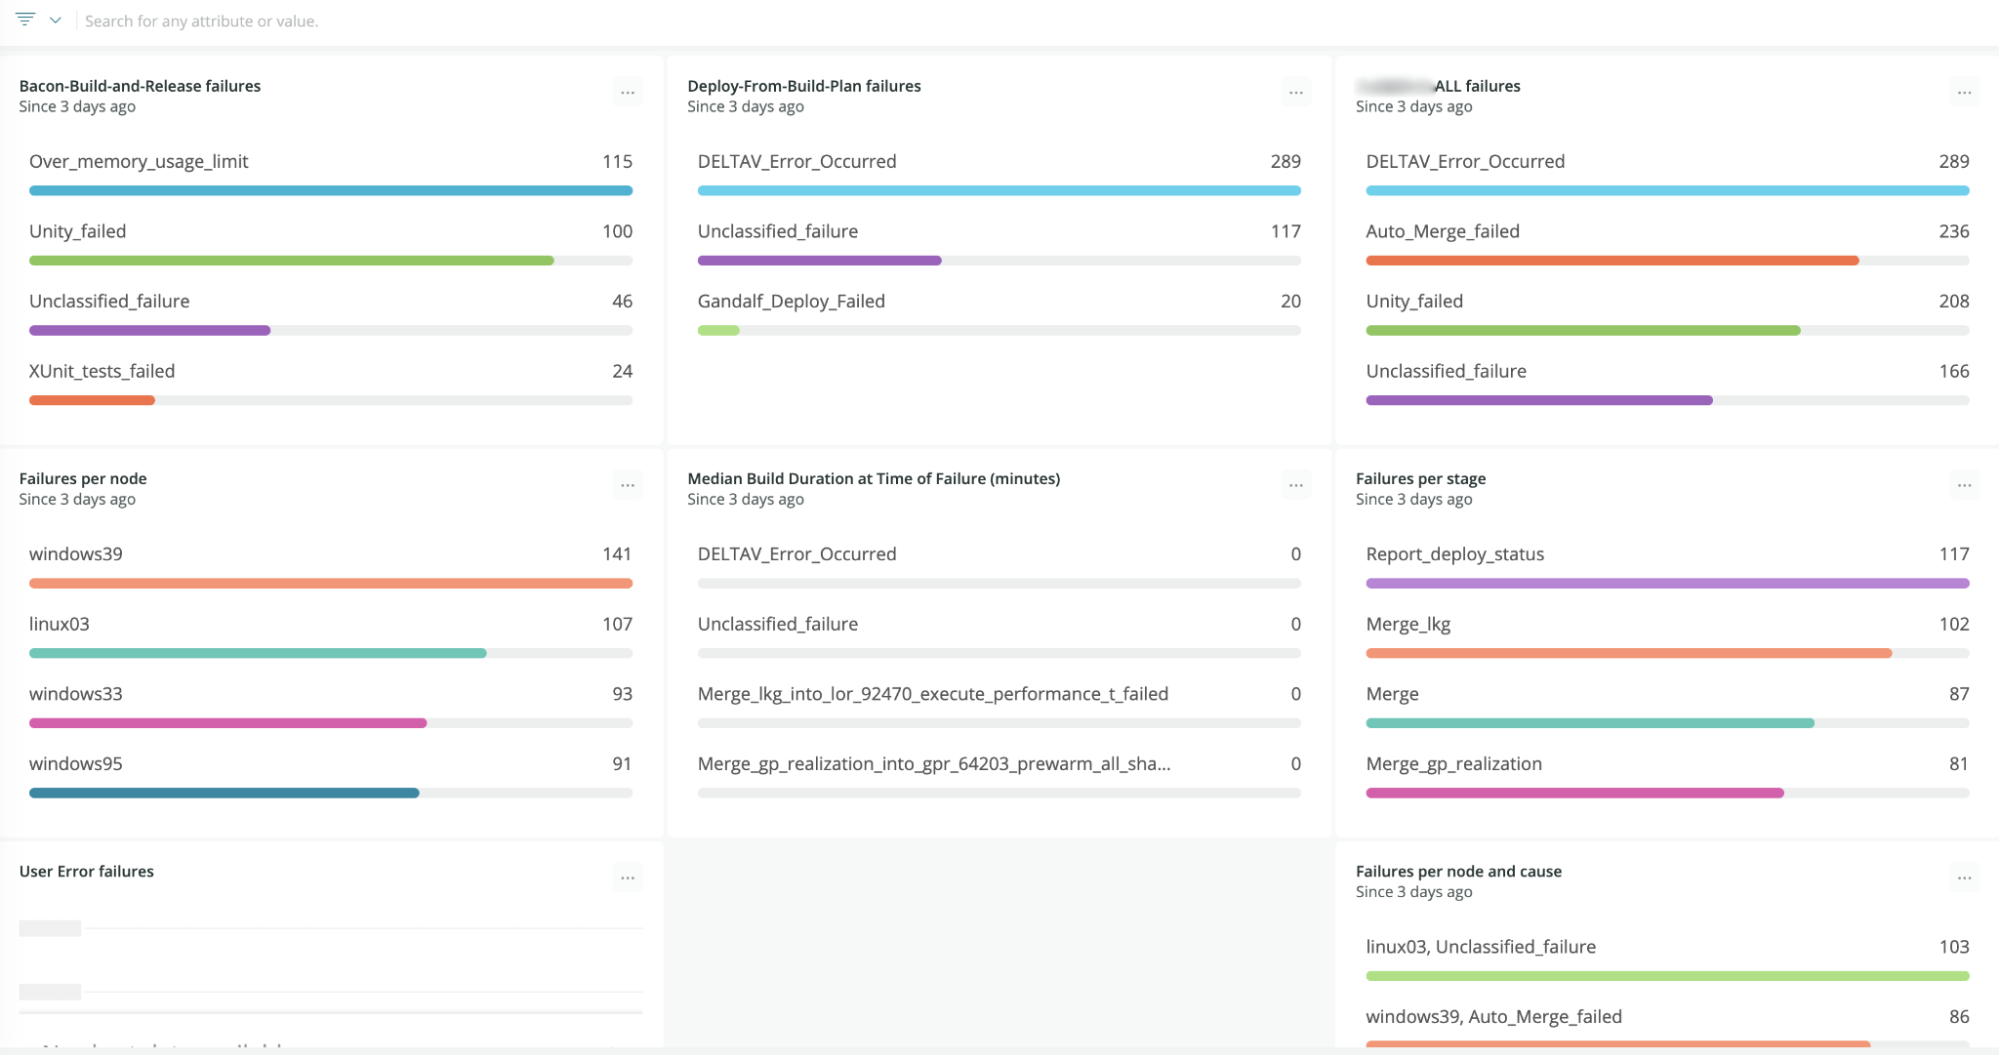
Our failure metrics dashboard in New Relic
Wrapping Up
Now that you’ve seen some of our past challenges and solutions, take a look at our next batch! Here are a few challenges we’re thinking about now. If any of these kinds of problems strike you as intriguing or exciting, take a look at our open roles and shoot us over an application!
A few items from our to-do list:
- If we have ~50 dependencies, and each of those dependencies has 99% uptime, our pipeline has only .99 ^ 50 = 60% reliability even before code changes.
- Could we switch to ephemeral build nodes? How would we bootstrap the workspace data? Could we switch to Linux-based Unity builds?
- Improving iteration speed on the pipeline itself.
Thanks for reading! Feel free to post comments or questions below.