
VALORANT's 128-Tick Servers
Hi, I’m Brent “Brentmeister” Randall and I’m an engineer on the Gameplay Integrity team for VALORANT. My team is responsible for VALORANT’s build system, automation framework, game client performance, and server performance. In this article, I’ll be focusing on that last topic - I’ll be telling the technical story behind our search for optimal server performance.
From very early on in development, we knew that VALORANT would have very strict server performance requirements. I hope I can give you some insight into why that is, and how we accomplished our ambitious goals. When we started, a server frame took 50ms, and by the end we reached sub-2ms per frame - all by looking at code optimization, hardware tweaks, and OS tunings.
Let’s go on a journey together.
The Importance of Netcode
All online shooters (even VALORANT) have some amount of peeker’s advantage. We’ve done a video blog on netcode and peeker’s advantage, and a previous Tech Blog article on the same.
To provide a short summary - in VALORANT, a key part of the gameplay is taking strategic positions and holding them. Holding positions can become impossible if other players can run around a corner and kill the defender before the defender can react due to latency. That latency is partly based on the network and partly based on the server tick rate. To give defenders the time they need to react to aggressors, we determined that VALORANT would require 128-tick servers. If you’re interested in how we came to that conclusion, our tech blog post on peeker’s advantage covers it in detail.
Code Optimization
When we think about hosting servers at a 128-tick rate, our biggest constraint is CPU resources. We need to be able to process an entire frame within 7.8125ms, but if we do that, a single game would take up an entire CPU core!
This diagram demonstrates how many games we can run per core:
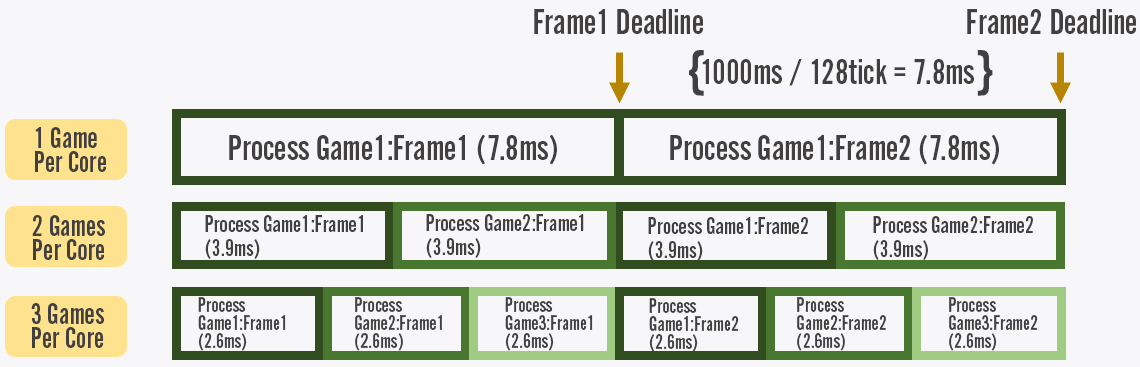
Utilizing 1 full core per game would make it prohibitively expensive to host our game servers at scale, considering we knew we wanted to offer 128-tick for free and not as a premium service players had to pay for. After crunching the numbers, we knew we needed to do better than 3 games per core (gpc). To put this in perspective, we generally run 36 core hosts, so each physical game server needed to host 108 games or 1080 players. Even 3 gpc was a massive investment, but Riot leadership understood and supported our ambitious server performance goals.
Let’s take that 7.8125ms, divide it by 3 gpc, and we end up with 2.6ms. But wait - we also need to reserve 10% for overhead of the OS, scheduling, and other software running on the host. After these calculations, we end up with a target budget of just 2.34ms per frame. When we looked at VALORANT’s initial data, we were at 50ms; we had a long way to go. This was going to be an effort that needed to involve the entire development team.
Breaking The Problem Down
“Make the server 20x faster” isn’t a very tractable problem, so we applied the single best tool in software engineering: Break a big intimidating problem down into smaller solvable problems. We needed to figure out where those 50ms were being spent so that we could start shaving it down. We sat down with the VALORANT technical leads and discussed what the big areas of CPU cost likely were and came up with a list of categories:
-
replication
-
FoW
-
network
-
animation
-
gameplay
-
movement
-
equippable
-
character
-
physics
-
other
Armed with this list, we built a system that allowed programmers to easily mark up game code and categorize them appropriately. Every line of code that executes is scoped to one of the above buckets using a macro system, and we added a concept of subsystems for finer grained analysis of larger systems. We called the system ValSubsystemTelemetry.
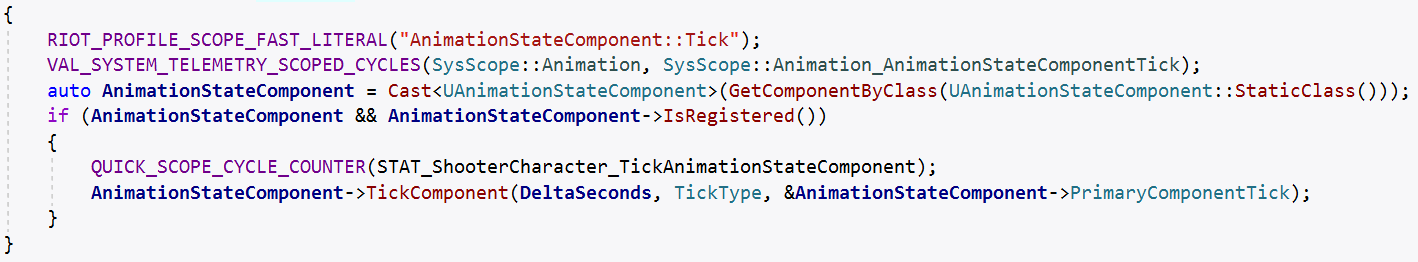
As the game runs, these scopes let us track how much time we’re spending in each category.
Leveraging Riot Tech: Analytics Platform
So now we’ve got a library and we’re generating all this data. What do we do with it?
Part of working for a larger studio like Riot means we’re able to leverage existing tools and tech that other teams develop and support. In this case, for example, a central team at Riot had developed a technology called the Analytics Platform. This tool allows programmers at Riot to publish data to our big data warehouse and then build visualizations around it.
Here are some of the ways we visualize performance data on VALORANT:
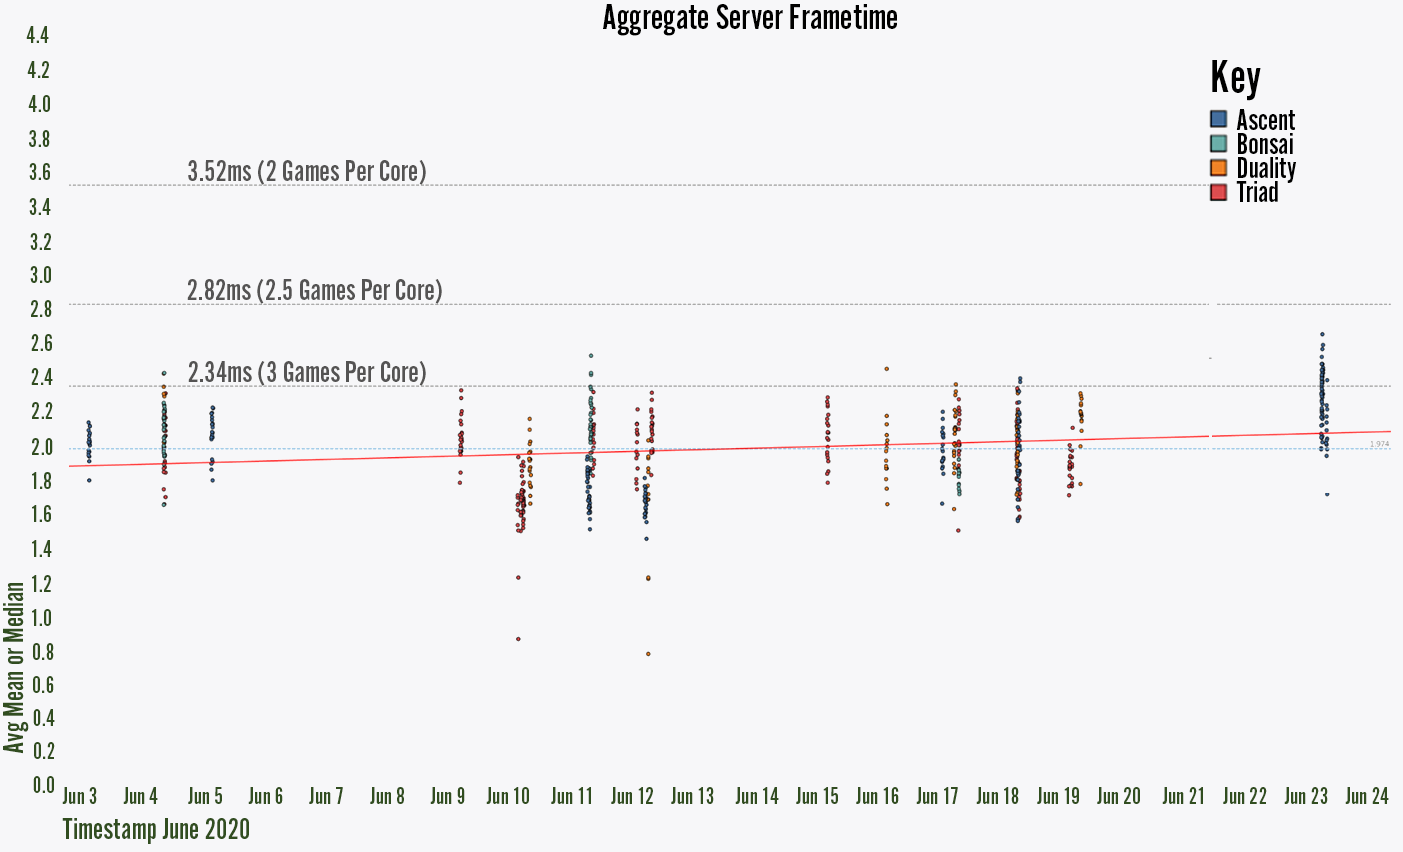
Average server frame time per round
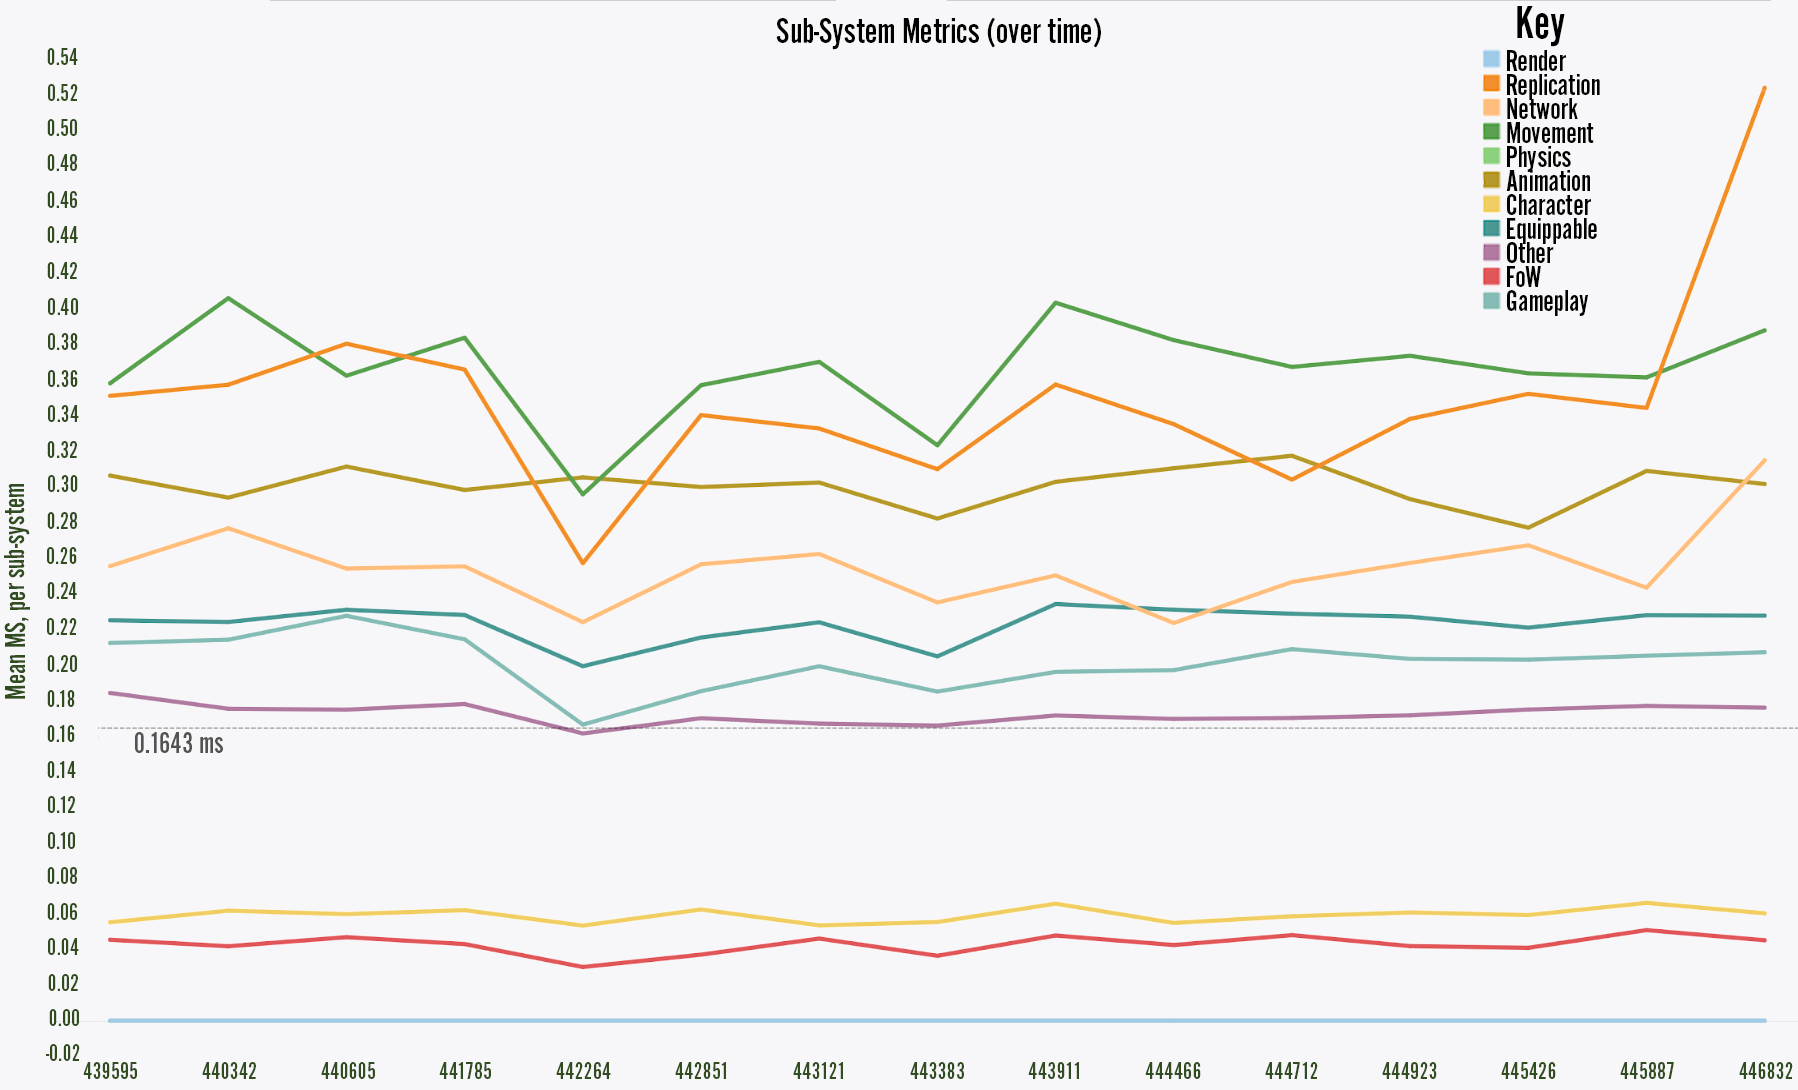 Average processing time of each VALSubsystem
Without data like this, it’s easy for non-performant code or content changes to make it into the game undetected. We might go weeks before these sorts of changes stack up to a breaking point where developers or players notice things slowing down.
Digging back through weeks of changelists to find culprits is costly work, but it’s a much easier task when you’ve been tracking performance data all along. In the second image above, for example, we can see that there’s a problem between change numbers 445887 and 446832 that caused replication (the orange line) to take longer. This type of visualization allows us to look through a much smaller set of changes and quickly assign an engineer to resolve the issue.
Performance Budgets for Subsystems
Now that we had the visualizations set up for data verifications, we were able to set budgets for each subsystem and follow up on any discrepancies. The VALORANT tech leads got together again and discussed what reasonable budgets would be for each of the systems. This was largely informed by where the systems were at that time, and what opportunities for optimization existed in systems according to the experts. From there, each team and expert had a goal in mind and we could work in parallel to get the performance to a shippable state.
Here we can see some of the early data organized by the categories mentioned above:
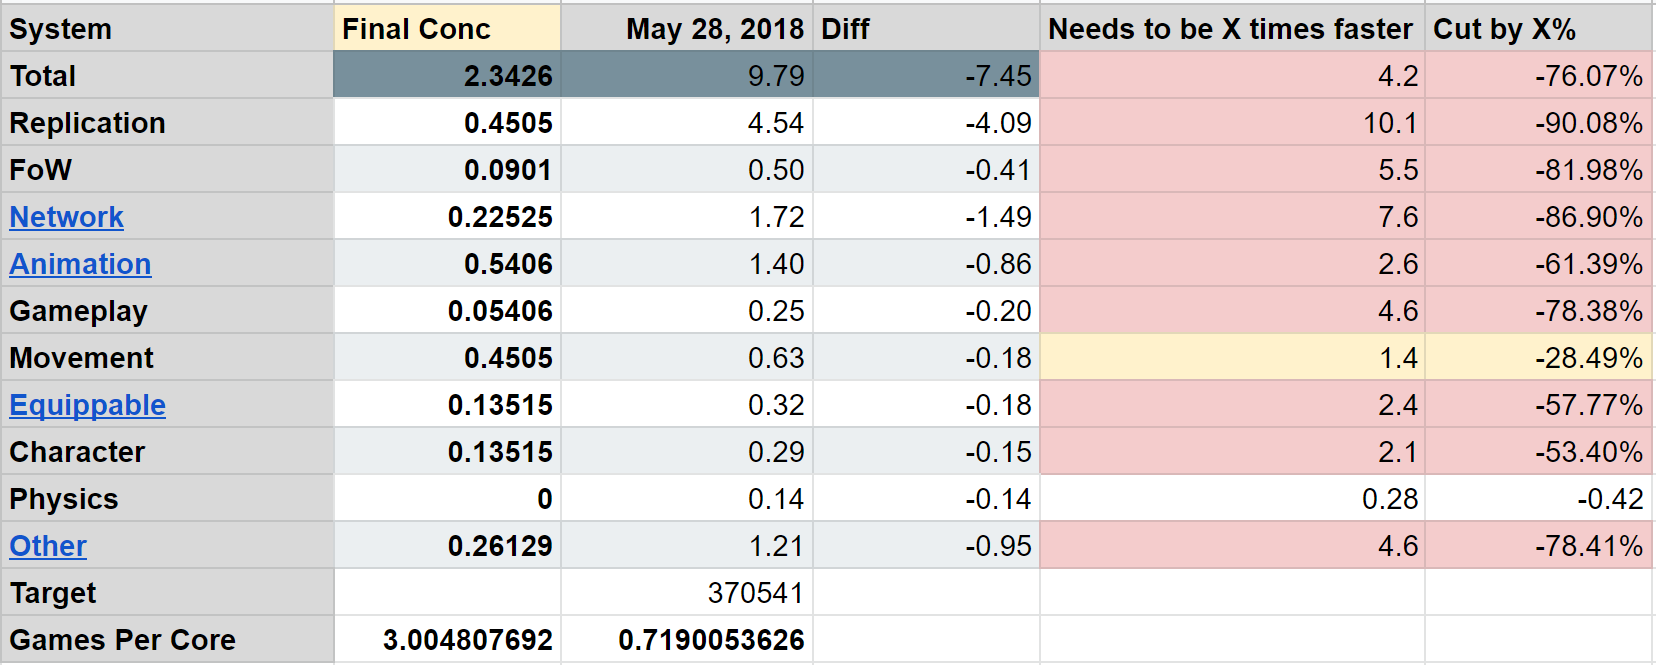 Let’s take a look at two specific sections to demonstrate how we whittled down performance costs. First we’ll focus on replication because it was the system that needed the biggest change. Then we’ll take a look at animation, because the changes we had to make are highly representative of the types of solutions we made across all categories.
Replication
Property Replication, which we often just call replication for short, is a system in Unreal Engine 4 (UE4) that allows for network synchronization of state between server and clients. It’s a great system for quickly prototyping new characters/abilities/features that require networking with clients. A developer can simply markup a variable as “replicated” and it will automatically be synced between the server and clients.
Unfortunately, it’s also pretty slow. It requires scanning through every variable marked as replicated every frame, then comparing it to each of the 10 clients’ last known states, and then packaging any deltas to send to the client. This is effectively random access across memory and is really cache-intensive, slow work. Regardless of state changes, the variables are still checked. I consider “polling” systems like this a performance anti-pattern.
The fix is to utilize another UE4 networking tool: Remote Procedure Calls (RPCs). RPCs allow the server to call functions over the network that execute on one or more of the clients. Using RPCs on state changing gameplay events limit the performance cost to the frame on which the state change occurs. This “push” model is far more performant. The downside is that designers and engineers have to think more carefully about placement of RPCs and handling cases like reconnect. However, we found in many cases changing from a replicated variable to an RPC offered a 100x to 10000x performance improvement!
As an example, consider player health. One way to network player health would be to mark player health as replicated. Each frame, the game server would check if the value has changed and if so notify the correct clients. With an RPC, you would likely send a “ShotHit” event from the server with the damage value. Clients would stay in sync by applying that damage to the player's health themselves.
Animation
Animation was a huge cost for us on the server side. To properly figure out if a shot hit or not, we need to run the same animations on the server that players see on their clients. Hit registration in VALORANT works by saving player positions and animation state in a historical buffer. When the server receives a shot packet from the client, it rewinds the player positions and animation state using the historical buffer to calculate if the shot hit. Initially we were computing animation and filling this buffer every frame. However, after careful testing and comparisons we found that we could animate every 4th frame. In the event of a rewind we could lerp between the saved animations. This effectively cut animation costs down by 75%.
Another important realization was that amortized server performance is the most important type of performance at scale. Imagine a VALORANT server running about 150 games. At any given time, ~50 of those games are going to be in the buy phase. Players will be purchasing equipment safely behind their spawn barriers and no shots can hurt them. We realized we don’t even need to do any server-side animation during the buy phase, we could just turn it off. So that’s exactly what we did - if you look at the server view, players are just in the idle pose during the buy phase. This helped reduce costs of the animation system over the course of a round by another 33%!
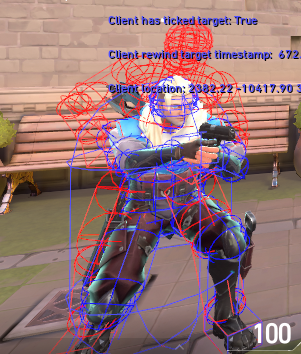
The red wireframe shows the server’s non-animated hitbox vs the client’s blue.
Real World Performance
Now you’ve got a taste of how we optimized the code - but performance is more than code. It’s also the platform you’re running on. So let’s discuss something that was causing huge issues with performance - the OS and hardware.
To properly test how our game was going to perform in the real world, we needed to fashion a load test. We had to know how the server would perform with 100+ instances all running on the same CPU. Building the load test was critical for successfully launching VALORANT. It allowed us to predict exactly how many cores we would need per player, and allowed us to solve a number of issues that only appeared at high load. Turns out, it’s not as simple as the 7.8ms / 3 games per core that I mentioned before.
(Editor's note: You can read more about load lesting for VALORANT here!)
First, let’s take a look at this chart. It graphs frame time on the Y-axis and number of instances on the X-axis.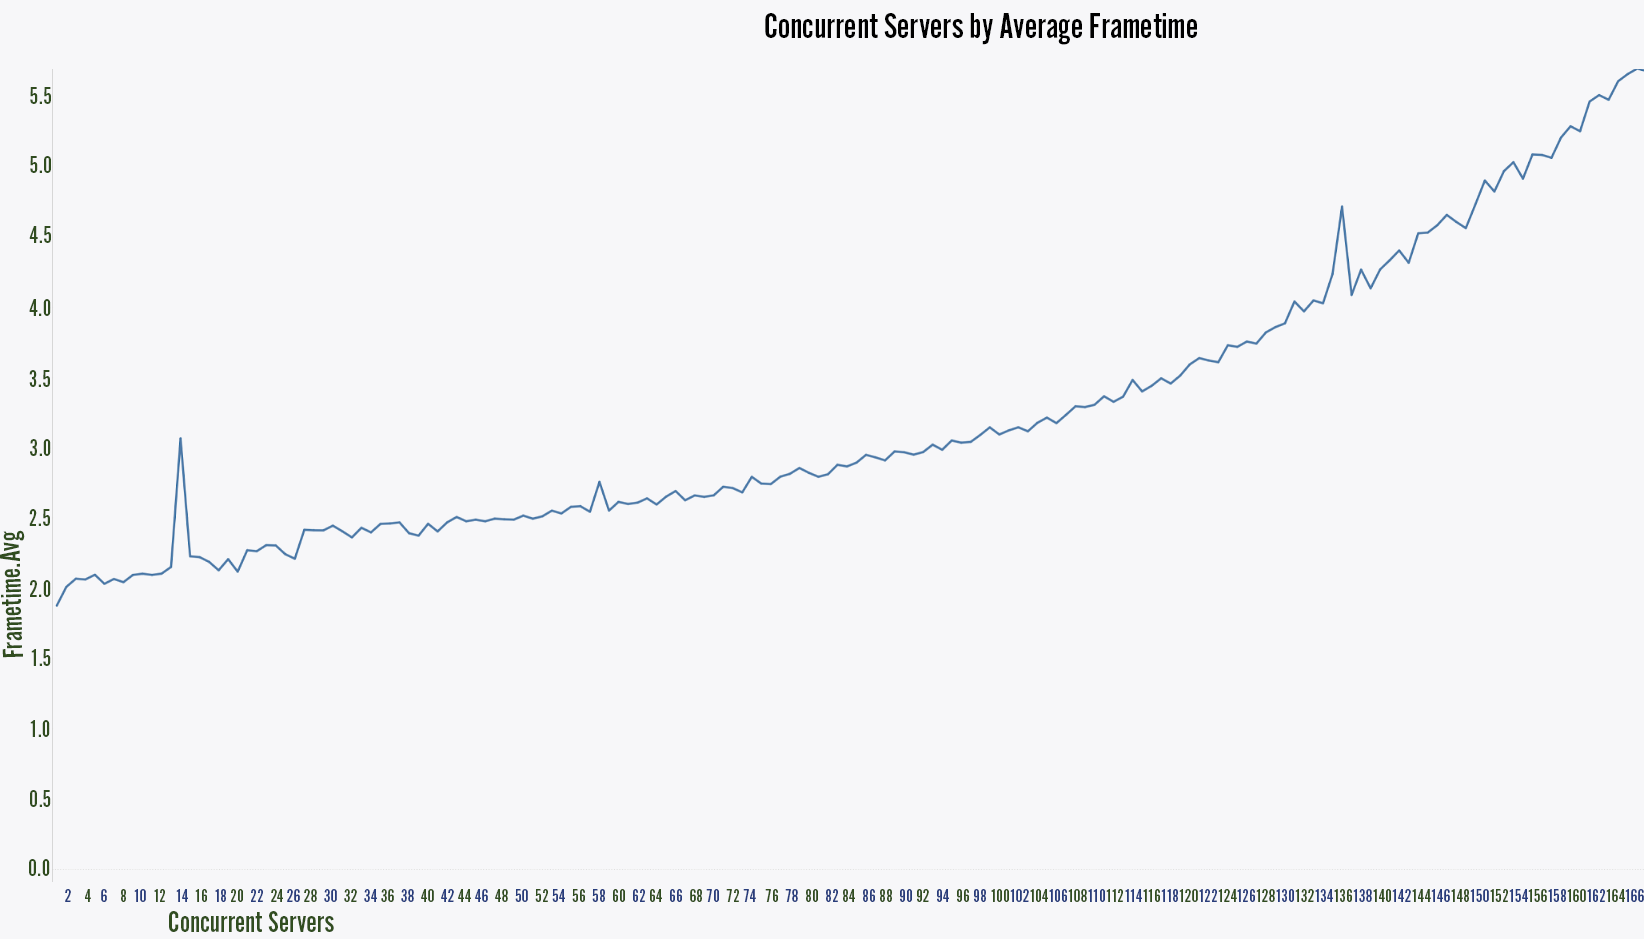
So with only a single instance running, we hit a glorious 1.5ms... but once we’ve got 168 instances running, we’re hovering around 5.7ms.
Oh no - what’s going on here? To understand why this happened and how we resolved it, we’ll have to first take a look at modern CPU architecture.
CPU Architecture
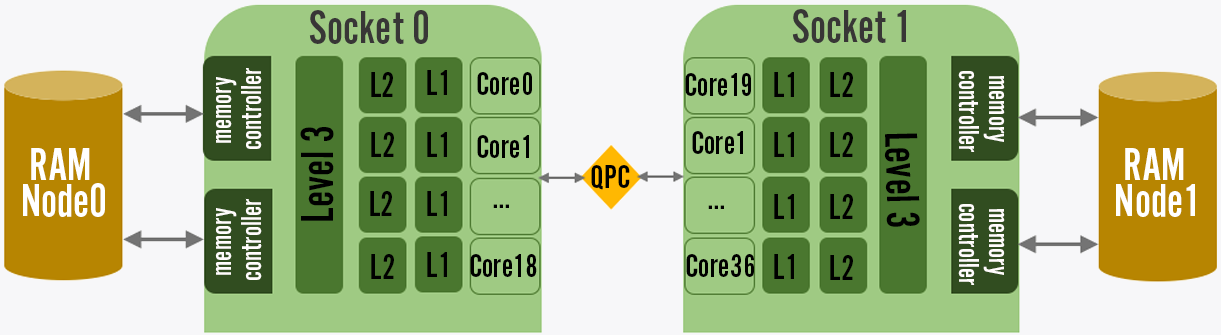
Take a look at the image above, and you’ll notice several important things. Each core has its own L1/L2 caches, but the larger L3 cache is shared between cores. With only one server running on the host, it gets to hog the L3 cache all to itself, which results in fewer misses - meaning the CPU core spends less time waiting on a memory request. That's why our low load scenarios had our servers running blazing fast, but they start to slow down as the cache grows more and more contended with each instance. We did some measurements with a team of cloud computing experts at Intel to make sure we weren’t hitting thermal limits or other factors, and narrowed it down simply to cache performance.
Collaborating with Intel
Luckily, Intel had a few tricks up their sleeves from their platform measuring and analysis tools. We were still running on the older Intel Xeon E5 processors, which made use of an inclusive cache. Basically, inclusive means that each cache line present in the L2 cache must be present in the L3 cache as well. If a line gets evicted from the L3 cache, it gets evicted from the L2 cache as well! That means that even though each L2 cache was separate, it was possible cores were thrashing one another’s L2 cache by causing evictions in L3 cache.
Totally unfair, don’t you think? With the Intel Xeon Scalable processors, Intel moved to a non-inclusive cache, completely eliminating this problem. Moving to the more modern Xeon Scalable processors showed major performance gains for our server application. We still see the effects of L3 contention but we saw roughly a 30% increase in performance, even using similar clock speeds.
Non-Uniform Memory Access
We wanted to push our memory performance even further. First, you’ll need to understand another aspect of modern CPU architecture called Non-Uniform Memory Access (NUMA). On server architectures, you often run dual (or more) socket CPUs. Each of these sockets has direct access to a portion of the system’s RAM, and shares data through an interconnect. This allows for increased memory bandwidth (2x more connections), but the interconnect can become a bottleneck. Revisiting the diagram above, you can see a simplified layout of a NUMA architecture with two sockets. If only the operating system could make sure to allocate memory and CPU resources to keep interconnect traffic down...
Well, it turns out that many modern OS are NUMA-aware and can do this. On Linux, for example, one way to do this is to use numactl when starting a process. On VALORANT, we start game server instances back and forth between nodes like this:
numactl --cpunodebind={gameid % 2} --membind={gameid % 2} ShooterGameServer
Making maximum use of the architecture with such a small change led to a performance boost of around 5%. We turned our memory access from about 50% NUMA local to 97-99% NUMA local! In addition to the 5%, performance was much more consistent between server instances.
OS Scheduler
During our time monitoring the game server host, we saw an interesting pattern where cores would hover at around 90-96% usage but never reach 100% - even when the host was loaded to 2x the number of games it should be able to host. We suspected the OS scheduler was the cause, so we used Intel’s PMU profiling tool, Adaptive Optimization, along with the perf utility on Linux to dig into scheduler events. Utilizing Linux also meant we had the chance to review the source code for the scheduler as well.
Through our investigations, we learned that modern Linux uses the Completely Fair Scheduler (CFS). The scheduler is really clever and has a number of optimizations. One optimization is that it tries to keep processes on the same core, preventing them from migrating to run on other cores. One reason it may do this could be to allow processes to reuse still hot cache lines. Another reason might be to prevent unnecessarily waking up idle cores to do small amounts of work. The migration cost would basically keep the process waiting on a busy core for a length of time before considering allowing it to migrate it to an available core. The default value for this in our Linux distro was .5ms.
In VALORANT’s case, .5ms is a meaningful chunk of our 2.34ms budget. You could process nearly a 1/4th of a frame in that time! There’s 0% chance that any of the game server’s memory is still going to be hot in cache. While an individual game server idles in between frames, the other game servers are utilizing the cache to its fullest extent. By lowering the migration cost setting to 0, we guarantee that the scheduler immediately migrates a game server that needs to run to any available core on the system. Doing this lets us make much better use of CPU resources on the system and granted another 4% performance boost. Additionally, we saw the amount of time individual cores spent idle drop to nearly 0% under load.
C-States
Another area where we found straightforward wins was in controlling the C-State that we allowed the CPU to enter. When a multi-core CPU runs, it allows cores to enter different power states. Under reduced load, cores will often enter lower states to conserve power. However, once load increases, it takes time for those cores to swap to higher power states. In highly cyclical workloads - like a bunch of game servers processing frames then sleeping - the CPU ends up swapping power states frequently. Each swap has a latency that negatively affects performance. By limiting our process to the higher C-States (C0, C1 and C1E), we were able to host another 1-3% games stably. It particularly stabilized performance of 60-90% loaded servers where the reduced workload was allowing many cores to frequently idle.
Hyperthreading
Hyperthreading is a CPU architectural technique where a single physical core can host two simultaneous threads. With hyperthreading, certain parts of the core are shared (like caches), and certain parts (like different compute units) are duplicated.
It ultimately depends on the specific CPU you’re looking at. Early on in development, we had 25ms frame times and we found that turning off hyperthreading yielded 20ms frame times. Performance increased across the board by 25%! However, our friends at Intel were skeptical. Given our load, we could potentially squeeze out more out of the hardware by making use of the virtual cores that hyperthreading offers. When we flipped hyperthreading back on, we saw performance increase by 25%.
How did this happen? Along the way we had reduced server frame time to well below our 7.8125ms target. We migrated to the Intel Xeon Scalable processors architecture which improved cache and hyperthreading performance. We tweaked the scheduler to make better use of available cores. We disabled C-States below C1E for better core latency and many other optimizations.
The Importance of Measuring
The lesson here is that each application's performance profile and considerations are different. Even the same application a year later can have drastically different performance needs. The only way to be sure is to create a reproducible test and measure.
If you just make a list of “performance tweaks” you might learn about in, say, a game dev blog post on the internet, and execute them without considering your application’s specific needs and considerations, you might hurt performance more than you help it.
Other Performance Optimizations
Clocksource
Games tend to frequently mark the passing of time. This is generally done by making system calls to the OS via the clocksource. An OS running in hypervisor environments (like AWS) might use virtualized clock sources that are less performant. On our AWS nodes, we were initially using the Xen clocksource provided by the Xen hypervisor. We changed to the tsc clocksource which is provided by the CPU instruction rdtsc. For our game servers, we were able to get about a 1-3% boost in performance by moving our clocksource.
Ghost Story: It Only Happens on Prod
As we neared our ship date we noticed that one of our game server load test hosts performed worse than the others. It was identical hardware and the only difference was that it was running our full deployment stack. Load tests run on this box generated double to triple the number of hitches or slow frames than ones running on hardware that I provisioned by hand. We investigated several angles - could it be the AWS hypervisor, configuration differences, or even just bad hardware? Nothing was panning out.
Eventually we decided to look again at the Linux scheduler with perf sched to just see if we could find some differences on how the processes were running. We found out that every 5 seconds like clockwork, 72 processes would start called scheduler_1 … scheduler_72. One for each virtual core. These would start and immediately kick any running game server off the cores. On highly loaded game servers, this caused a cascading number of hitches. It turned out that Mesos, which we were using for our deployments, utilized Telegraf for metrics, which made DNS requests every 5 seconds, which were hijacked by dcos_net, an Erlang application.
Erlang has a configurable for how many threads its scheduler is allowed to spawn. The default is one thread per core on the system, hence the 72 processes. Once we set this to a more reasonable default like 4, the problem disappeared overnight. The lesson here is that it’s vitally important to measure performance in a configuration that matches your production environment!
Conclusion
Ultimately, it’s easy to miss the forest for the trees. Even in this quick fly-by through some of our performance efforts, the technical minutiae can stack up quickly. It’s easy to get lost in tiny details, tweaks, and oddities.
You’ve really got to continually revisit and reinforce the holistic performance goals you have in mind. Make sure you align the entire team around your goals so that you can enlist the right help from your team at the right time.
Code optimization is a big portion of performance, but you need to be able to break down your application performance into discrete chunks. And don’t forget about optimizing the environment (hardware and operating system) to host your application in the most efficient way.
Above all measure, measure, measure. VALORANT’s measurements ultimately allowed us to launch while predicting our server hardware needs within 1%. This resulted in a smooth launch experience and free 128-tick servers for our players.
I’d like to end with a special thanks to the Intel team who worked with us to investigate the hardware and OS tunings.
- Kim McLaughlin
- Harshad S Sane
- Dory Simaan
- Prabha Viswanathan
Their insight and contributions were invaluable for helping us meet our performance goals.
Thanks for reading! If you have any questions or comments, please post them below.