Profiling: Real World Performance in League
Hi, I’m Tony Albrecht, an engineer on League. You might remember me from such articles as Profiling: Measurement and Analysis and Profiling: Optimisation where we looked at how we find and optimise performance bottlenecks in the LoL code base. In this article, we’re going to take a step back and look at how we detect and then fix real world performance issues that slip out past our QA and monitoring systems and escape into the wild to plague you, The Player.
Detecting performance problems in a live game is trickier than it sounds. For example, what is bad performance? Is it a low average frame rate? Some number of slow frames? Some other metric? What constitutes a slow frame? On what hardware? With which operating system? What other software was running in the background? Once you do somehow detect a performance issue, how is it reported? How do you collect and parse logs for a game that’s played millions of times every day? And how do you reproduce the game state that triggered the performance issue so you can fix it?
This article will answer several of these questions and introduce you to some of the cool performance metric collection systems we have in place for League.
On the Trail of Sweetheart Rakan
League is an evolving product, and as such, bugs are going to slip through. These bugs can be gameplay, art, or even performance bugs (and sometimes all three at once). Bugs that cause a crash are generally easier for us to detect and fix since Bugsplat collects game logs and dump files, which we can use to reproduce the state of the game at the point of the crash. We can then analyse that crash to figure out what caused it and fix it.
Since performance bugs generally don’t cause crashes, we don’t have a convenient method of reproducing or even identifying them. Despite our best efforts to squash bugs before they make it out into the wild, we sometimes learn of issues through Player Support or even Reddit. These anecdotal accounts are usually too vague to pinpoint what triggers the performance issue, further highlighting the importance of robust profiling.
For example, “I was playing as Aatrox and kept lagging in teamfights, Rito pls!” doesn’t help us much. Was it Aatrox causing the issue or one of the other champions in game? Was it associated with the casting of a particular ability? Was it a combination of abilities? Or was it a problem with the player’s hardware? Or operating system? Or network? We can’t fix it if we can’t reproduce it.
Even professionals can struggle to identify the cause of a slowdown: in an NA LCS match in March 2018, Cloud 9 reported a significant framerate drop during a team fight. The trigger for the slowdown was reported as Azir’s ult.
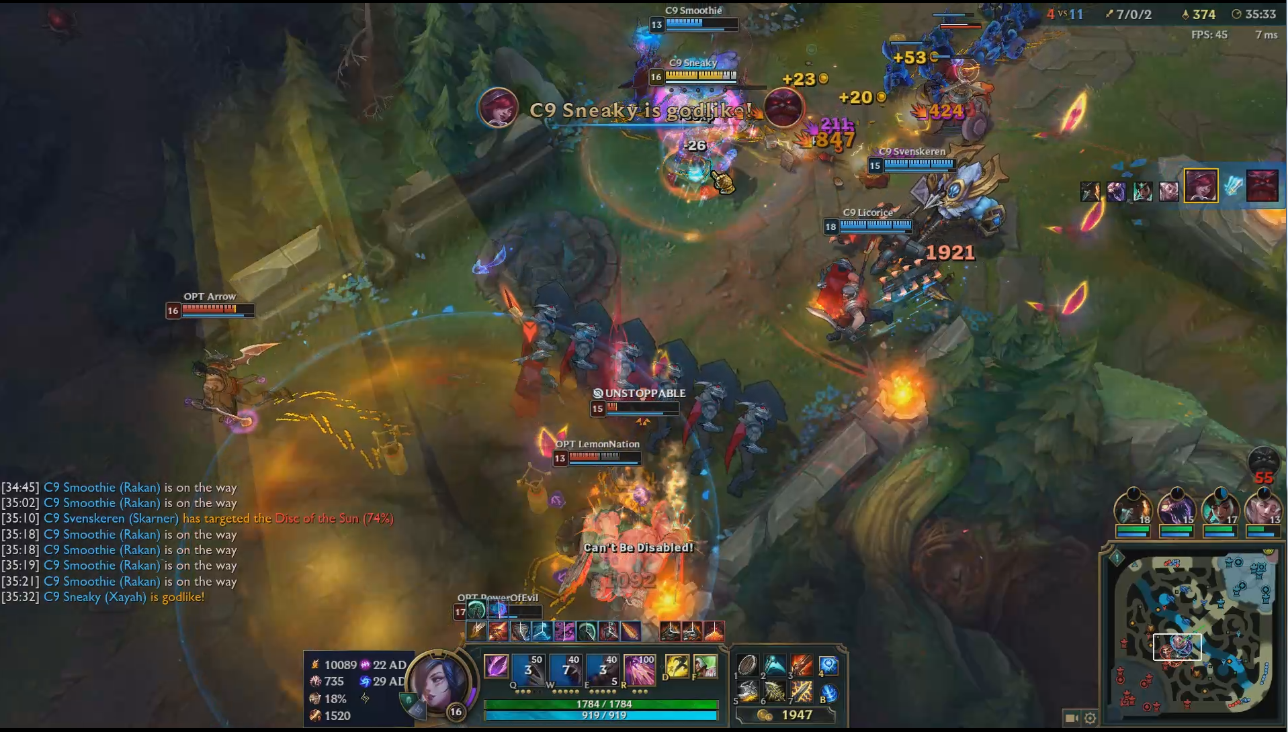
As you can see, there’s a lot going on here, but the FPS counter is definitely way lower than it should be. Was it due to Azir’s ult? Or was it something else? The FPS meter is deceptive - it reports on the average frame rate over the last few seconds, so the cause of frame rate drop is not necessarily what you are seeing on screen. In the image above, the decrease to 45fps is due to something that happened in the last few seconds so it may not even be visible on screen.
If only there was a way to replay that game so we could profile it...
Replay... replay… We have replay files! We can get the replay file of a game if we have the game id, and then we can use that to see if we can reproduce the performance issue. We have to jump through a few hoops to do this; replays expire with the patch they were made on, so we need to use the exact patch version the replay was recorded with. Also, live builds don’t contain all of our profiling code but with version control we can easily build what we need. Replay runs aren’t exactly the same as the original run - there is significant time spent decrypting the replay file itself, and the HUD is different - but overall, a replay is similar enough to allow us to find gross performance degradations. It’s worth noting that the game, unlike the game server, isn’t deterministic (check out Rick’s Determinism series on that here). This means we have to account for slightly different results when rerunning the same replay.

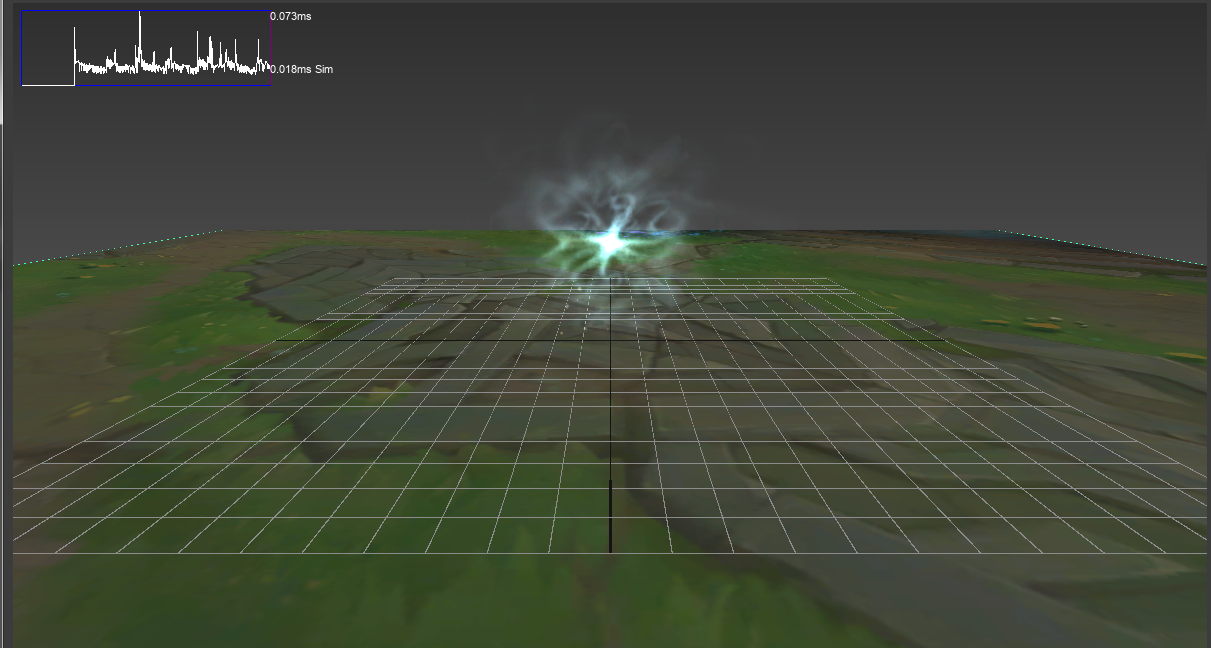
The replay of the Cloud9 game allowed us to step through to the time of the reported performance degradation. We could then replay the exact team fight that triggered the slowdown and use the in-game profiling tools to identify the cause. Turns out it was a particle system. The image below contains only the particles in the scene. Can you find the culprit?

I’ll make it easier for you - here are just the triangles of the particles rendered:

Yeah, I couldn’t find it either. In-game profiling confirmed that there was definitely a performance drop around that time. Something was taking a long time to calculate on the CPU; it wasn’t GPU related. With a Profile build, we can save out a trace dump which we can load into chrome://tracing to view. Doing so showed the following:
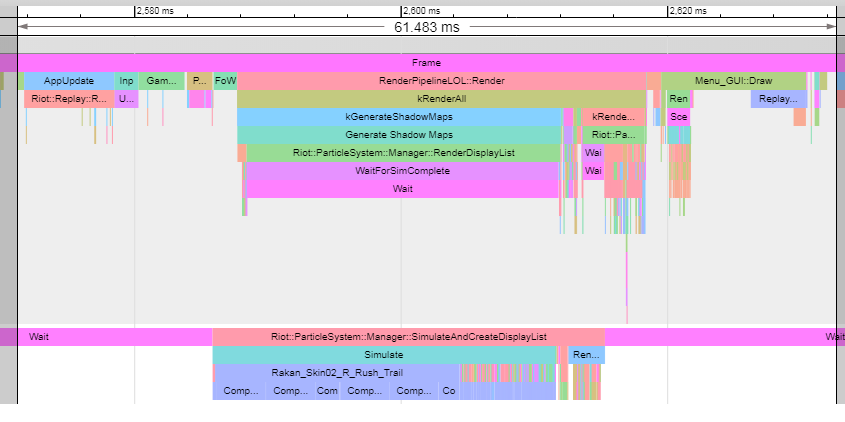
See this previous article for an explanation of how to read this trace dump.
The top graph corresponds to the main thread of League. The bottom graph is the Particle Simulation thread, where a lot of the particle work happens in parallel. The longer the coloured function block, the longer the function is taking to execute. The cause of the performance degradation is obvious now. Rakan_Skin02_R_Rush_Trail - Sweetheart Rakan’s ult (in dark blue) was causing the slowdown. The question was why?
Deeper inspection of the particle effect in question revealed that Rakan’s trail was highly interpolated: it contained a lot of triangles, which made it smooth but slow to generate. The level of interpolation was proportional to the speed of Rakan as well, so the faster he moved, the more interpolation there was and therefore the more CPU time was required to build that trail. The fix was to change the trail to be independent of Rakan’s speed. It ended up looking almost identical, but took far less time to generate.
We had to ask ourselves a few questions here: how did this slip through our testing? And perhaps more importantly: why wasn’t this picked up before testing? The answer to the first question is that we should have picked it up, but as I mentioned earlier, it’s hard to identify exactly what causes any specific slowdown and this slipped under our guard. The second question is an important one. We should have known how expensive this effect was before we shipped it, but we didn’t. And we didn’t know because we didn’t have any profiling built into our particle creation tool so there was no way for our artists to measure the cost of any particular effect. That was the second thing we fixed.
Because performance is everyone’s responsibility.
Shadowing Swain
To fix a performance issue you must first be able to reproduce it. If you can’t reproduce it, then you can’t test your optimisation against the previous state to measure if it is better or worse. To reproduce a problem we need accurate reports and sometimes even the same hardware.
Back in 8.3, Riot was receiving reports of performance degradation when Swain was in game. This was after a visual and gameplay rework, so we naturally assumed that we’d done something wrong in the process of reworking Swain. Reports from players were varied, ranging from being wildly inaccurate to identifying the exact trigger. We attempted to reproduce the cases that sounded plausible, but had no luck. We looked at Swain’s ravens, his ability effects, his skin, and his animations, but nothing showed up as a significant performance hit.
After trawling through some of the more detailed reports from players, we noticed a couple of common comments in some of the reports:
-
Players were running on low spec machines.
-
Swain was in view and the player was attacking him.
We managed to reproduce the performance issues by running two game clients and a server on a mid-spec machine. This produced enough drain on the GPU for us to see the problem: hovering the mouse over an opponent’s Swain resulted in a drop in FPS. Now that we had a repro we could figure out what caused the slowdown and move on to the “fix it” phase.
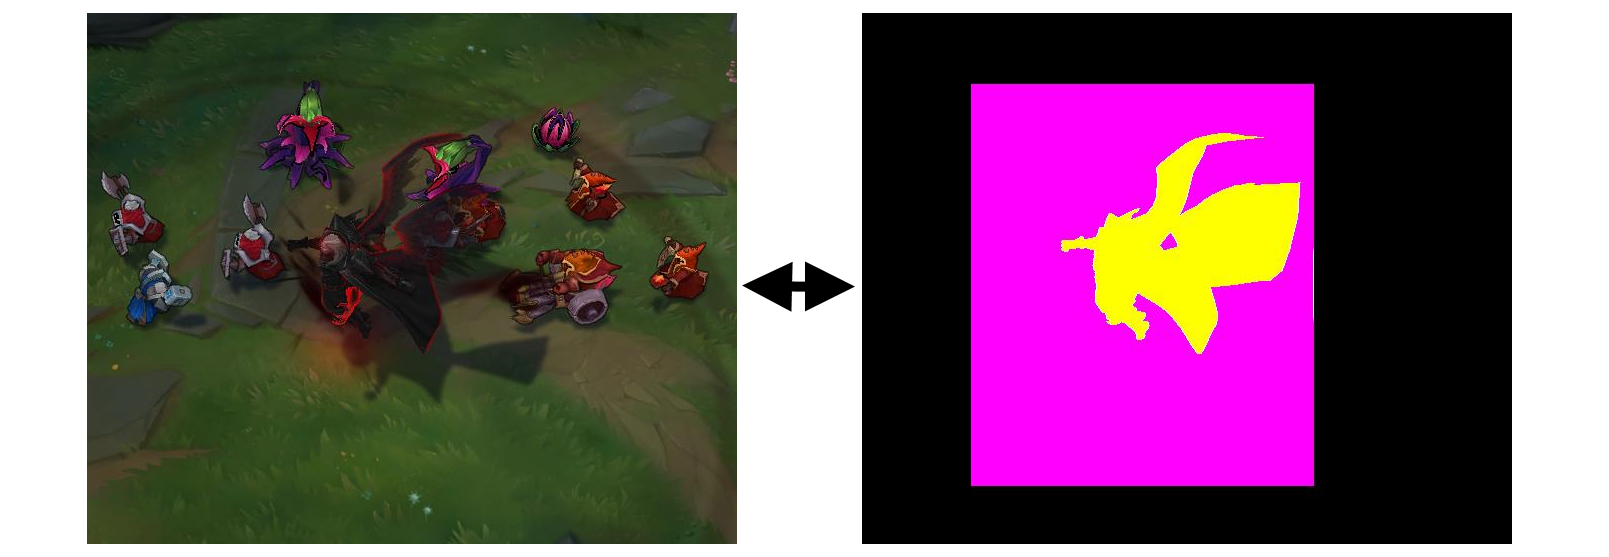
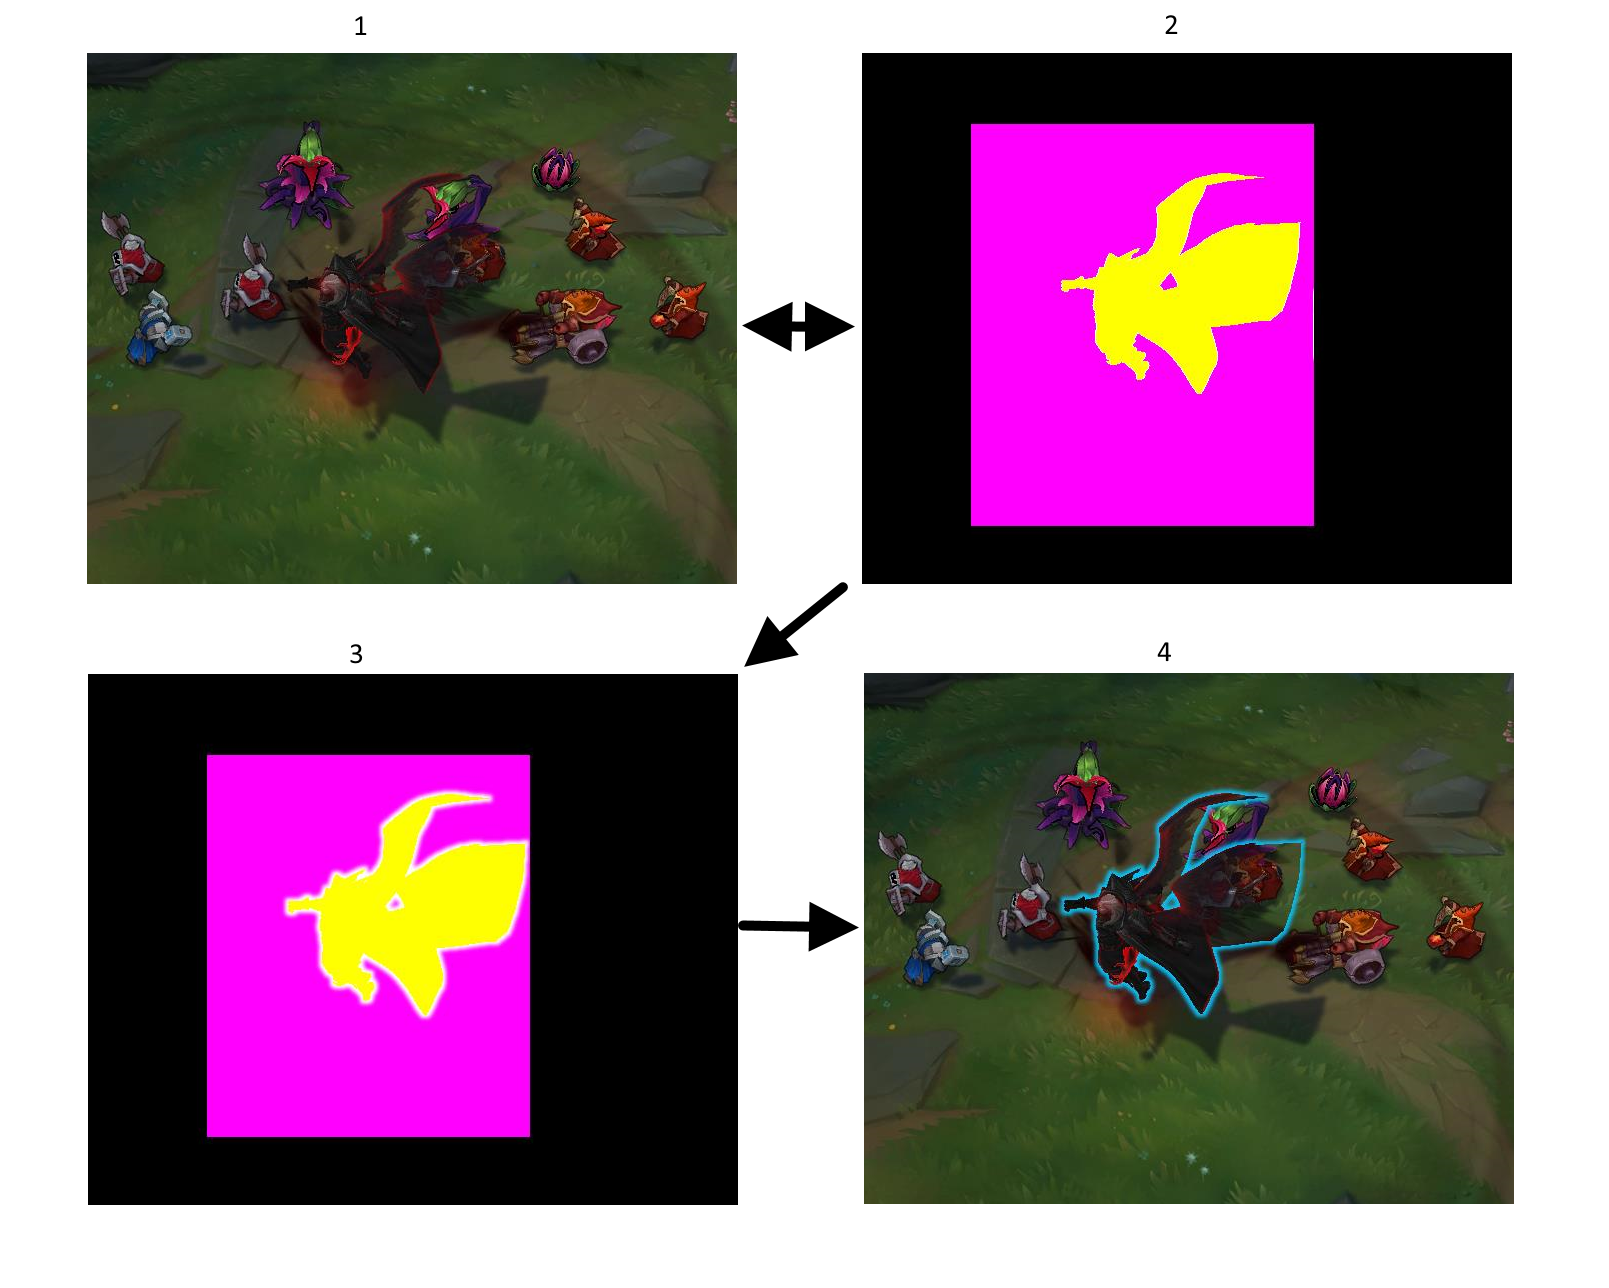
The slowdown was triggered whenever a player hovered their mouse over an enemy Swain, but not when a player was playing as Swain. The difference here is that we draw an outline when a player hovers another player’s champion for clarity. The image below shows how outlines are rendered. As a champion is rendered to the main frame buffer, a single colour version of the champ is also rendered to a secondary, offscreen buffer using multiple render targets (steps 1 and 2). The single colour mask is then blurred (step 3). This process is fast on high spec machines, but on lower spec machines it can be quite expensive (this is why shadows are expensive on lower spec machines as well). The cost of this blur is per pixel, so the more pixels blurred, the more expensive the effect. To minimise this cost we use a bounding box to limit the champion’s bounds and blur just within that region (the magenta box). We then use the blurred texture in the offscreen buffer to render an outline on the champion (step 4).
The problem with Swain in this case was that his bounding box was way too large. We discovered this by running the repro through a Graphics Performance Analysis tool (like Intel’s GPA) which allowed us to break down the scene into individual rendering commands and then visualise them. Turns out we were blurring more than 90% of the screen to draw his outline and that was taking a very long time on machines with slow GPUs.
The fix for this was simple: reduce Swain’s bounding box size. The reason for the overly large bounding box in the first place was that Swain’s ult form was larger than most, meaning our default bounding box wouldn’t suffice. To compensate, we applied a multiplier to the size of the bounding box. It wasn’t clear how much bigger the multiplier made the bounding box, and there was no noticeable slowdown on the high spec machines we originally used to build the champ or the lower spec machines we tested on, so Swain shipped with a massive bounding box. Performance data after the fact is important, but clearly visible data on what a change does in the editor can also stop performance problems before they happen.
Summary
To fix a performance issue you must be able to reproduce it. As you can see from the cases above, that can often be very difficult. Some cases require specific circumstances or only occur on certain hardware configurations. Robust profiling systems can help us to isolate those issues, but issues will inevitably slip out into live builds. When that happens, we rely on player reports to help pinpoint those issues, but that’s not always a complete picture. Replays of games can help us to reproduce the problem, but even they don’t work in all cases.
We’re levelling up our performance monitoring and testing patch by patch. Our goal is to maintain (and sometimes improve) performance even as we add in new content. If you play League and you notice a performance drop, please let us know but also try and be as specific as possible. Your insight into our performance problems does help.
Part 1: Measurement and Analysis
Part 2: Optimisation
Part 3: Real World Performance in League (this article)