Improving the Developer Experience for Operating Services
Hello! I’m James “WxWatch” Glenn and I’m a software engineer on the Riot Developer Experience: Operability (RDX:OP) team. My team focuses on providing tools for Riot engineers and operations teams that help them better understand the state of their live services across the globe.
Some of these tools include Riot’s service metrics, logging, and alerting pipelines. In this article, I’ll be talking about our one-stop-shop application for Rioters operating services - Console.
Before Console
Building Console has allowed us to deprecate and remove many of the standalone custom tools that we discussed in a previous blog post. But before we get into the details of Console, let’s set the context of this problem space using an example of a troubleshooting experience an engineer would have had using these tools prior to the creation of Console.
For this example, we’ll use a service my team owns called the “opmon.collector” - this service is the primary interface that services at Riot use to send logs and metrics to our monitoring platform. The opmon.collector is deployed in datacenters across the globe.
In this case, an alert triggers for opmon.collector and we need to figure out why.
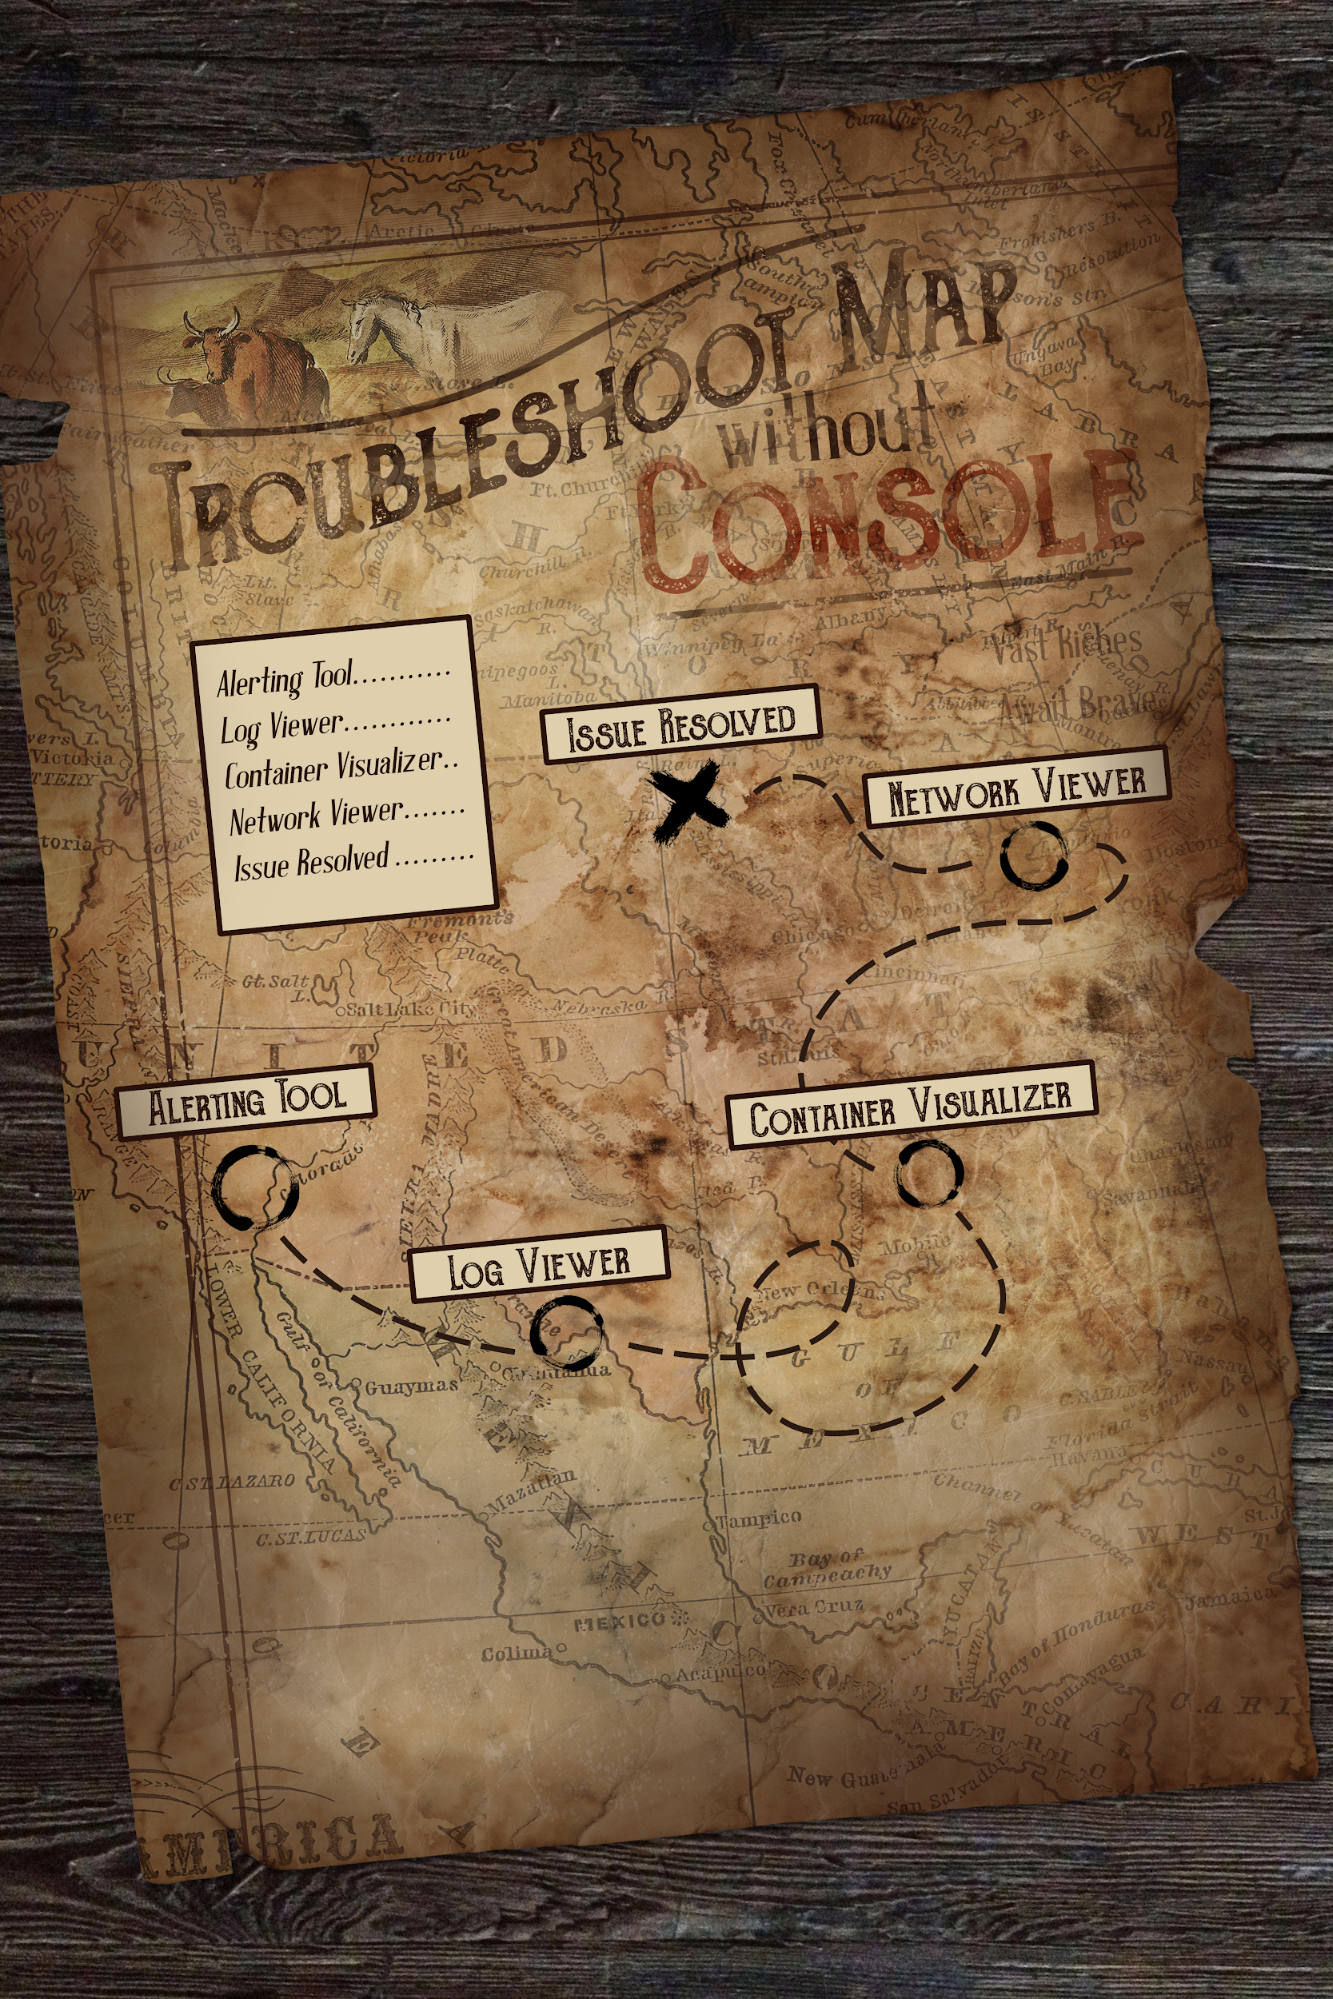
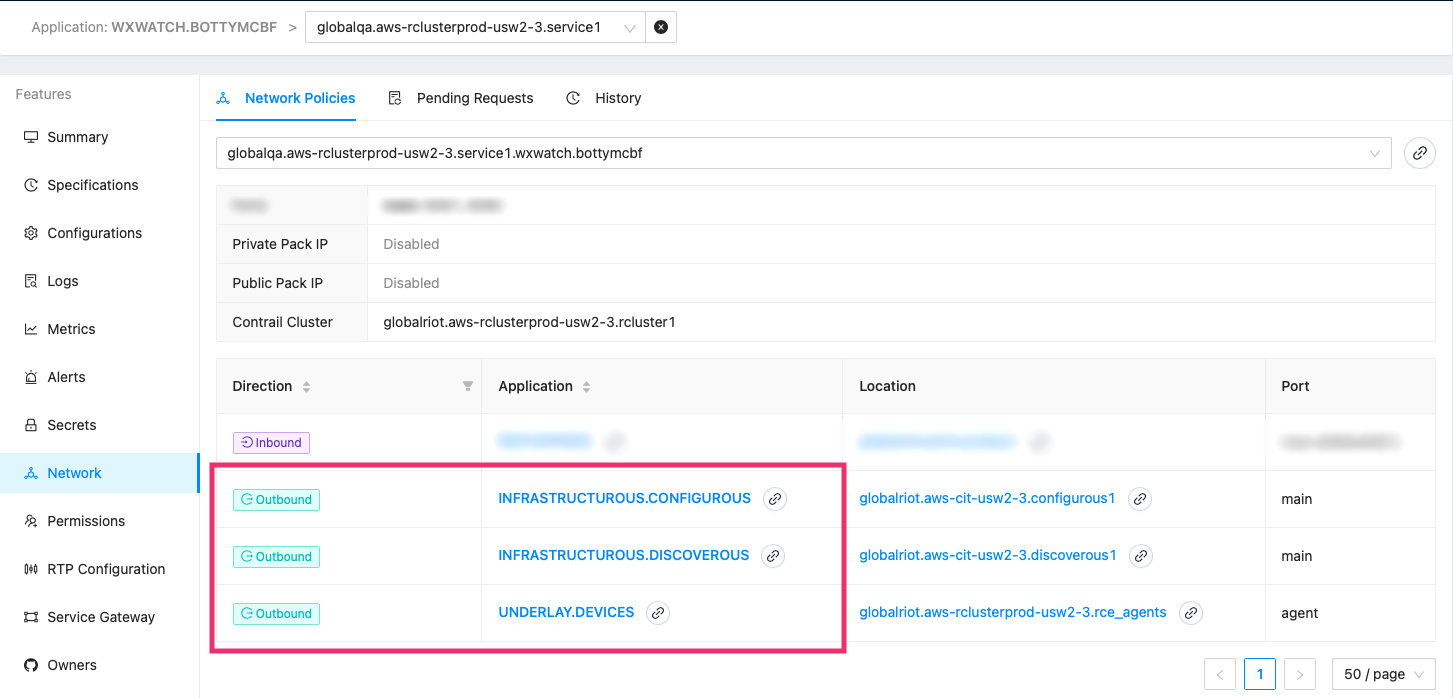
A map to guide you through this example.
To view the alert details, we’ll need to open up a browser, navigate to our alerting tool, and enter the service name and location to view the active alerts. From the active alerts, we see an alert saying we’re exceeding our allowed number of API timeouts, so let’s go check the logs to see if we can pinpoint the issue further.
To view the logs, we’ll log in to our monitoring platform log viewer and type in the service name and location, only to discover that there are no logs for this service instance in our monitoring platform! Since the service’s logs are not making it to our monitoring system, we'll need to look at the container logs directly.
To do this, we turn to our container visualizer, Toolbox. Inside Toolbox, we once again drill down to the appropriate cluster, find the service and open it up. Looking at container logs, we’re able to see that our issue is that the service is unable to connect to a dependency service. To further diagnose this, we need to look into our service’s network rules.
Navigating to our Network Viewer, we again have to search for the service. Once found we can open up the network rules and, upon inspection, discover that our service is missing a rule to allow it to communicate with a dependency. From here, we can add that rule and resolve the issue.
Great! We were able to use these tools to identify the issue. Each new tool we used, however, required us to reestablish the context of our search, which, in this case, was our service’s name and location. A more subtle inconvenience is that it required us to know the existence of (and have access to) all these tools in order to uncover the cause of our issue. Over time, this adds up to a significant amount of inconvenience, not only day-to-day as an engineer, but for one-time events like onboarding.
One Console to Rule Them All
![]()
We built Console to solve these inconveniences. We took the core functionality of these bespoke tools (and many more) and bundled them into a single tool with a unified context and UI.
This means that you find your service once via the search bar and everything you view is within that context. In addition to removing many of the tools that were mentioned in the previous section, we’ve been able to include features that would be nearly impossible to manage across multiple tools (e.g. Console has Dark Mode).
To illustrate this, let’s go through the same example as the section above, but this time we’ll use Console.
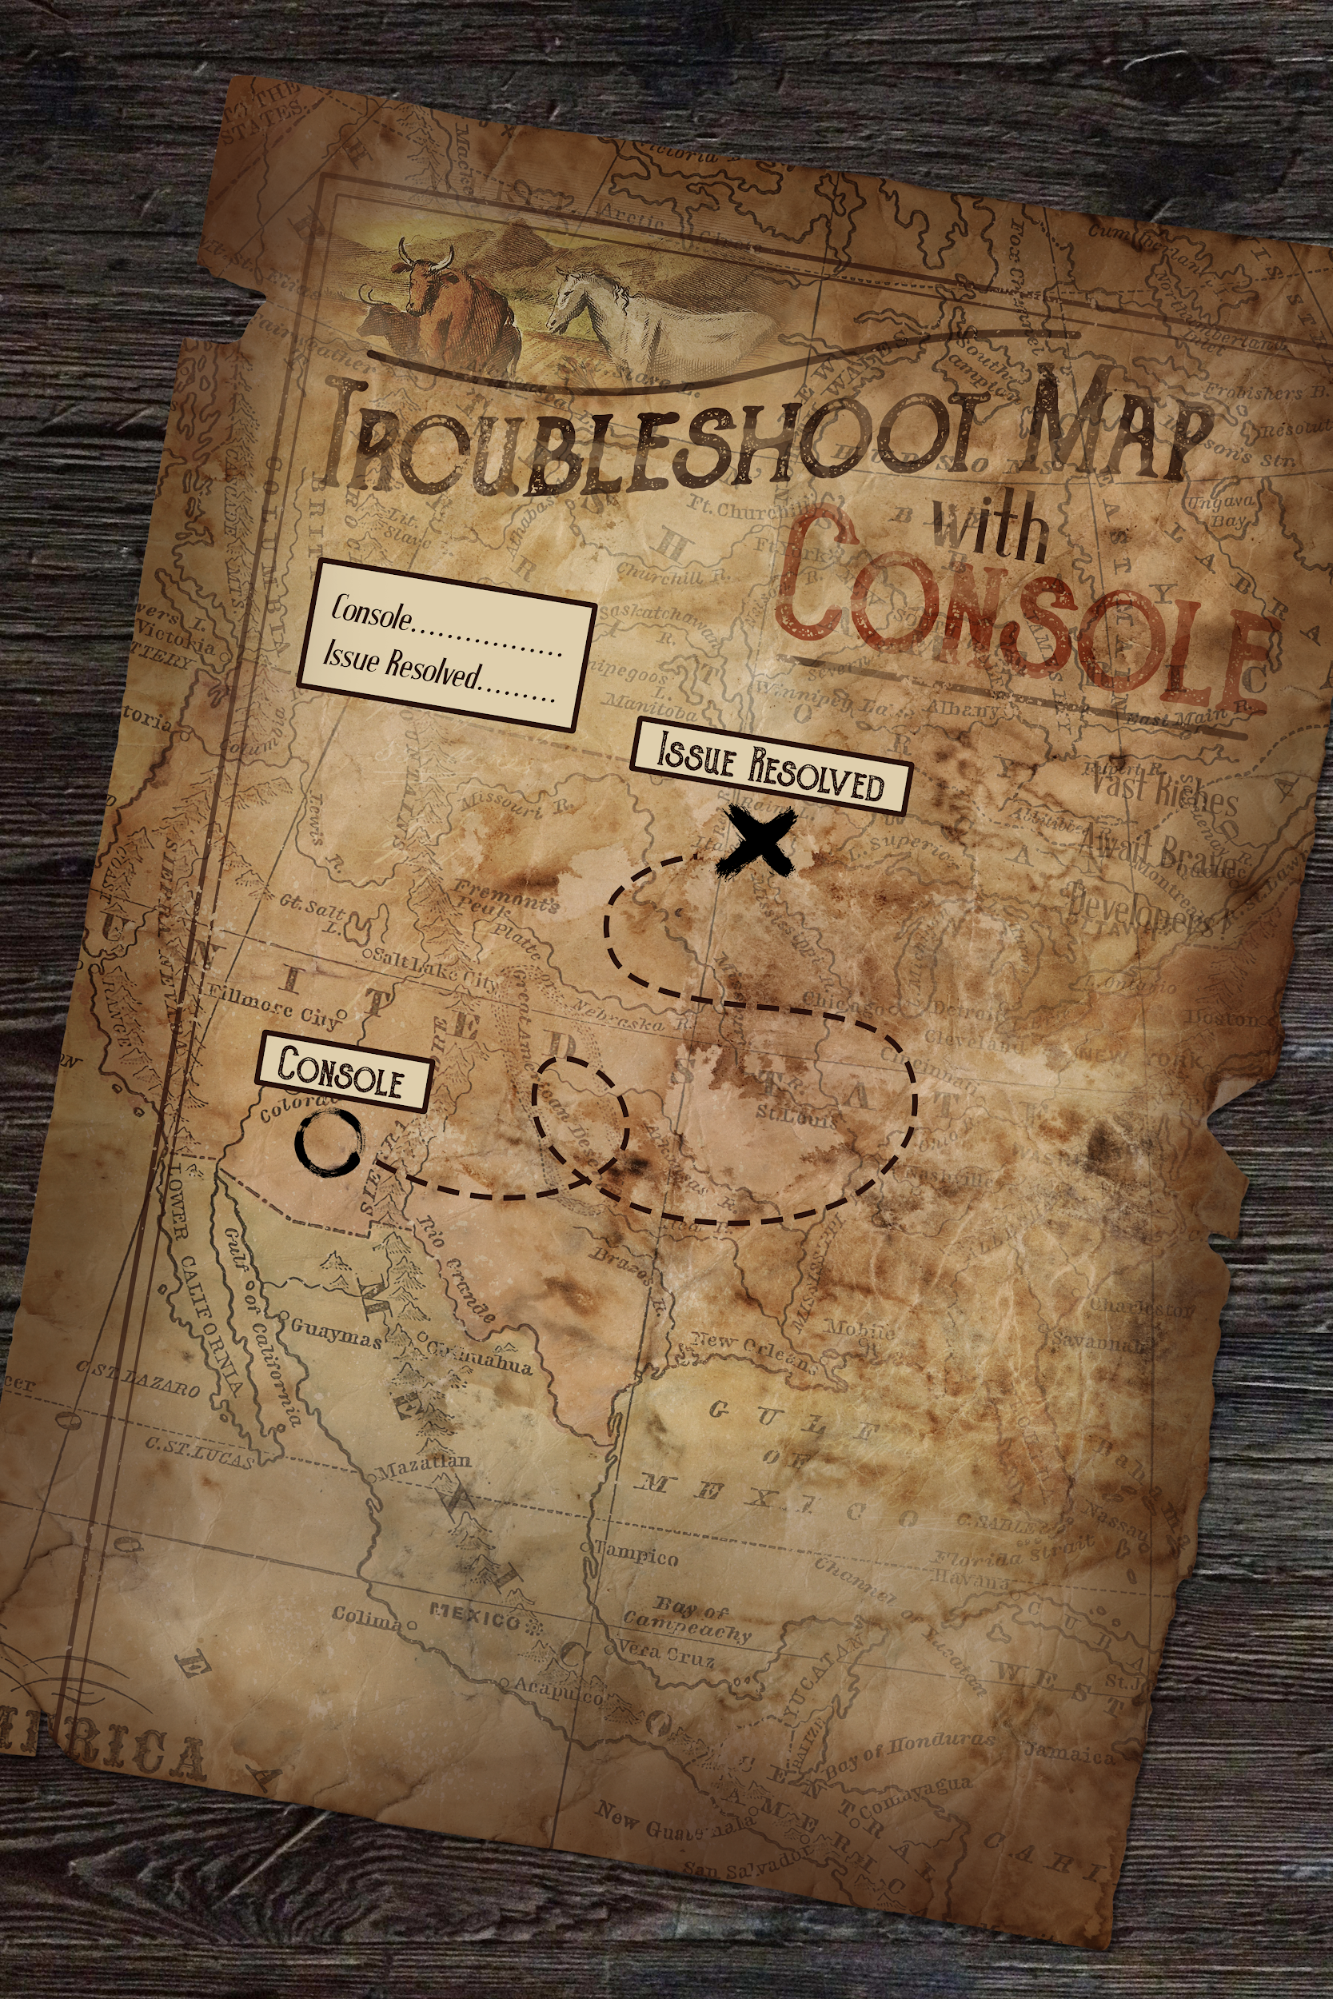
Treasure obtained in a fraction of the time.
First, let’s check logs:
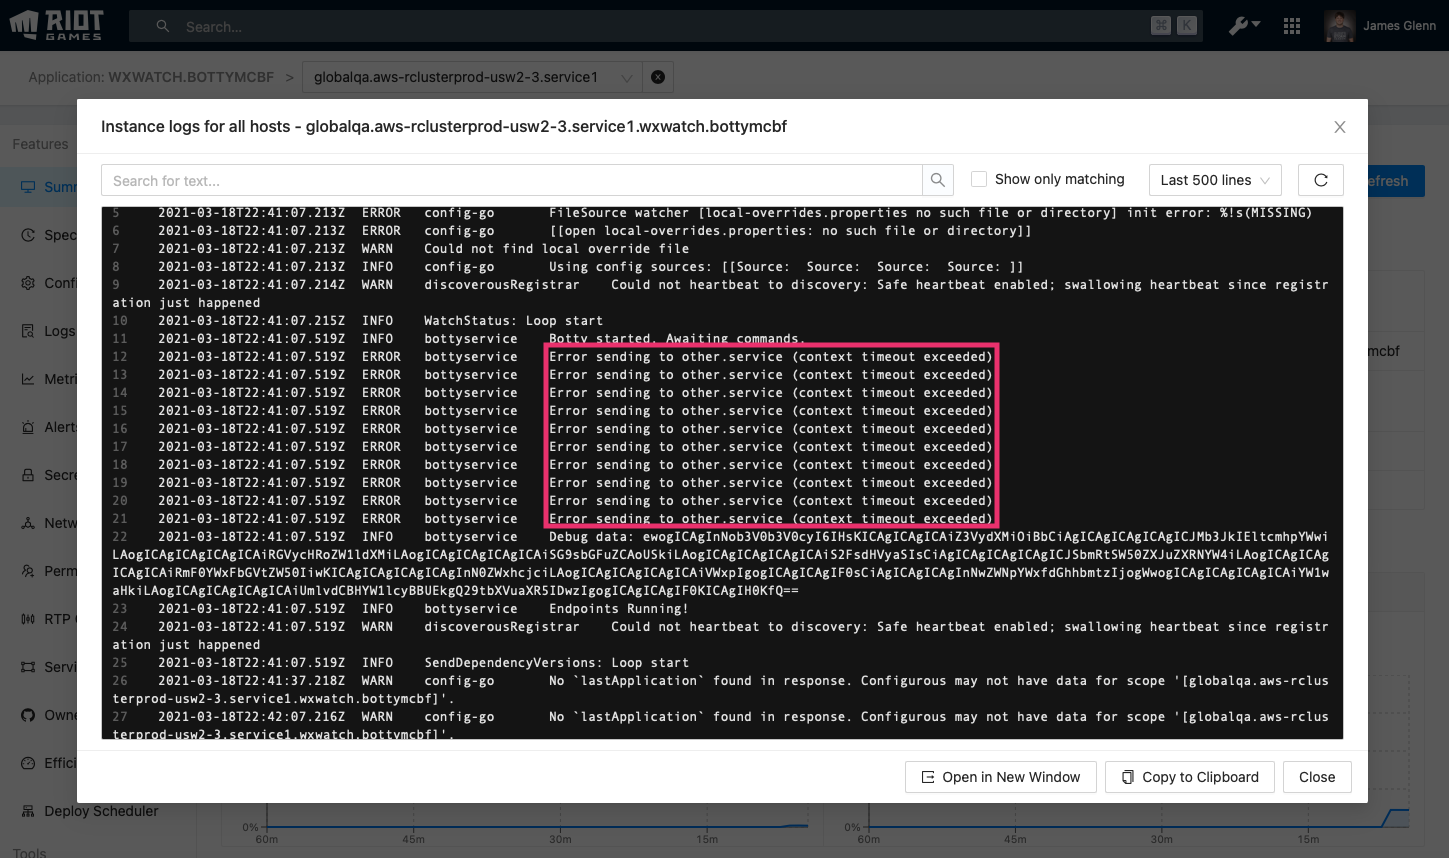
As before, we see there's a network issue. Let’s check out the network rules, where we see that our service does not have the necessary network rule to other.service, as before.
These are the same triage steps as before, but because of Console, we're able to easily navigate between the features we needed and more quickly determine the cause of the problem.
Going from “Yet Another Web Tool” to Console
Combining all these tools into a common interface was not as straightforward as it initially seemed. To get the best experience, there were two main goals we needed to accomplish. First, we needed to distill all the useful features from every tool while leaving behind or rethinking the features that typically went unused. And second, we needed to provide a way for other teams to get their data and features into Console.
To accomplish this first task, we followed a “player experience first” mindset. My team’s audience - our version of “players” - are Riot engineers across the entire company, from game developers to infrastructure teams. If we can improve their experience by decreasing the amount of friction when using tooling, then we’re increasing the amount of time they have to work on features and games for players. To figure out everyone’s wants and needs, we just, well, asked them. We created design documents and wireframes and interviewed and surveyed engineers across Riot. This gave us a solid picture of what was (and wasn’t) important to developers.
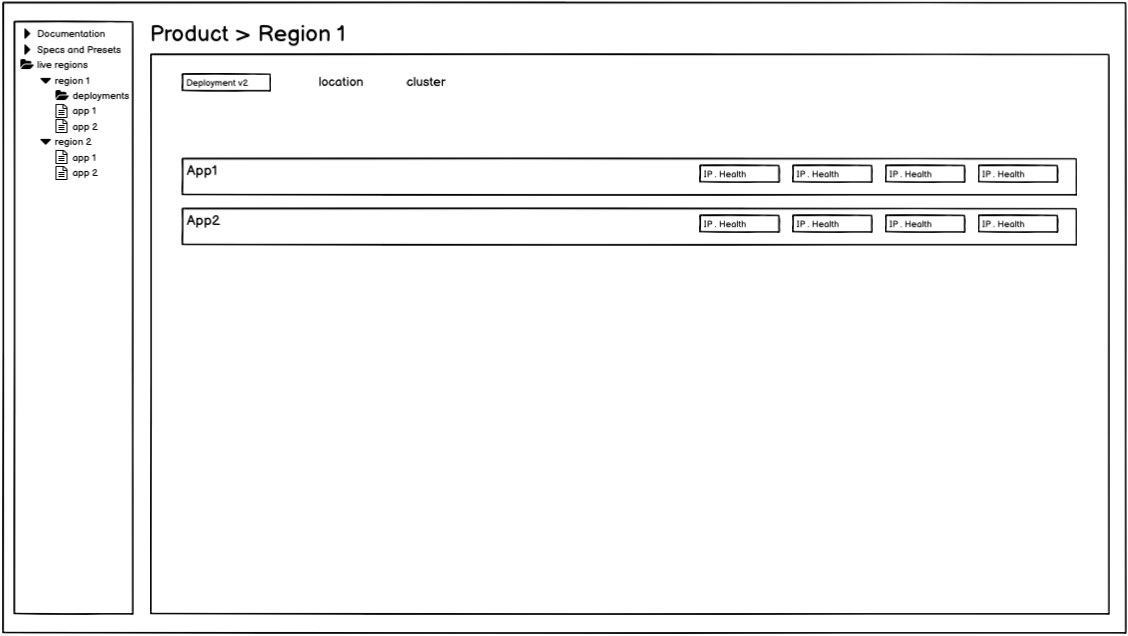
An early Console wireframe
Providing a straightforward path for other teams to build features in Console boiled down to one major hurdle: Not all teams have dedicated front-end engineers, and teams don’t want to spend a lot of time designing and building a user interface. The manifestation of this hurdle in the past was the collection of pre-Console tools we talked about earlier - they were typically built using whichever JS framework (React, Angular, etc) and UI framework (Material, Bootstrap, etc) the team decided on at the time, meaning no two tools looked or felt the same.
Technology and Template Time
Now that we know what we wanted to accomplish with Console, let’s talk about how we did it. Console’s back-end is a Golang service that gathers data from services across Riot, caches it, and communicates it to the front-end via REST APIs. Console also provides a proxy that the front-end can use to communicate with other services directly, in the case where no additional processing is required on the back-end. This eliminates the need for an engineer to write boilerplate APIs simply to fetch data from services. Console’s front-end is a React application using Typescript for type checking (we initially used Flow but recently migrated to Typescript) and Ant Design for its UI components.
This architecture allows us to focus on having a consistent UI across the entire application. To help maintain consistency, we built a series of templates that teams can use when integrating their own features into Console. These templates give teams a framework to work with and allows engineers with less front-end experience to still be able to quickly build out good, consistent UIs within Console. It also lowers the barrier to entry, as it eliminates the need for engineers to come up with content from scratch.
Consistency alone isn’t good enough though. We knew we needed to prioritize a good overall user experience so people would be motivated to use Console. It‘s a tool that engineers use every day, so any inconveniences - no matter how small - add up over time, generating a lot of pain and annoyance. Because of this, we focused on making sure Console not only has the right data, but also is easy to navigate and understand. For navigation, each feature in Console is scoped to specific service types and is only visible when viewing a service of that type, ensuring relevant features are easily accessible. Also, since Console collects data from different sources, we help the user understand the origin of the data they’re viewing by providing unobtrusive tooltips that display the data’s source.
Additional Features
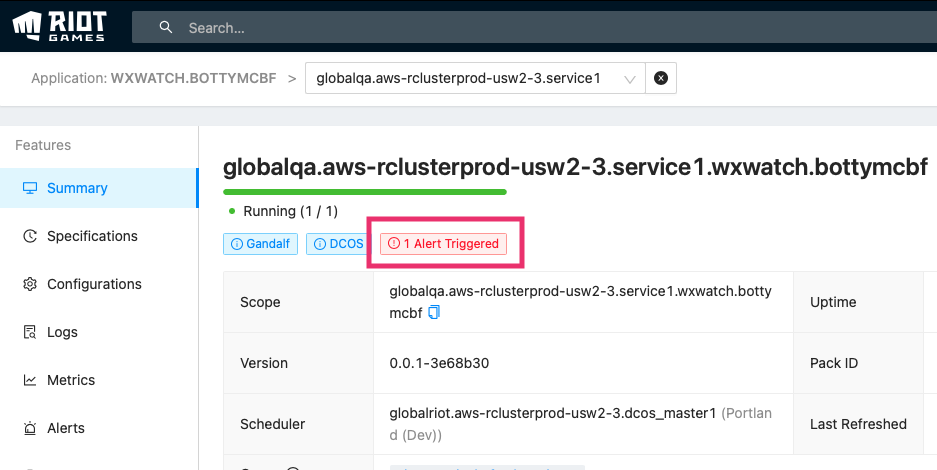
Now that we have all the data in one place, we can begin to correlate data that we weren’t able to previously. For example, since Console knows if a service is alerting, it can display that alert as a notification on the service summary page.
Console has many additional features that aren’t covered in this article:
-
Ability to view service specification and deployment status/logs
-
Configuration view, including when a configuration value was last changed
-
Kill/Restart individual instances of a service
-
Ability to schedule service deployments
-
Service health viewer
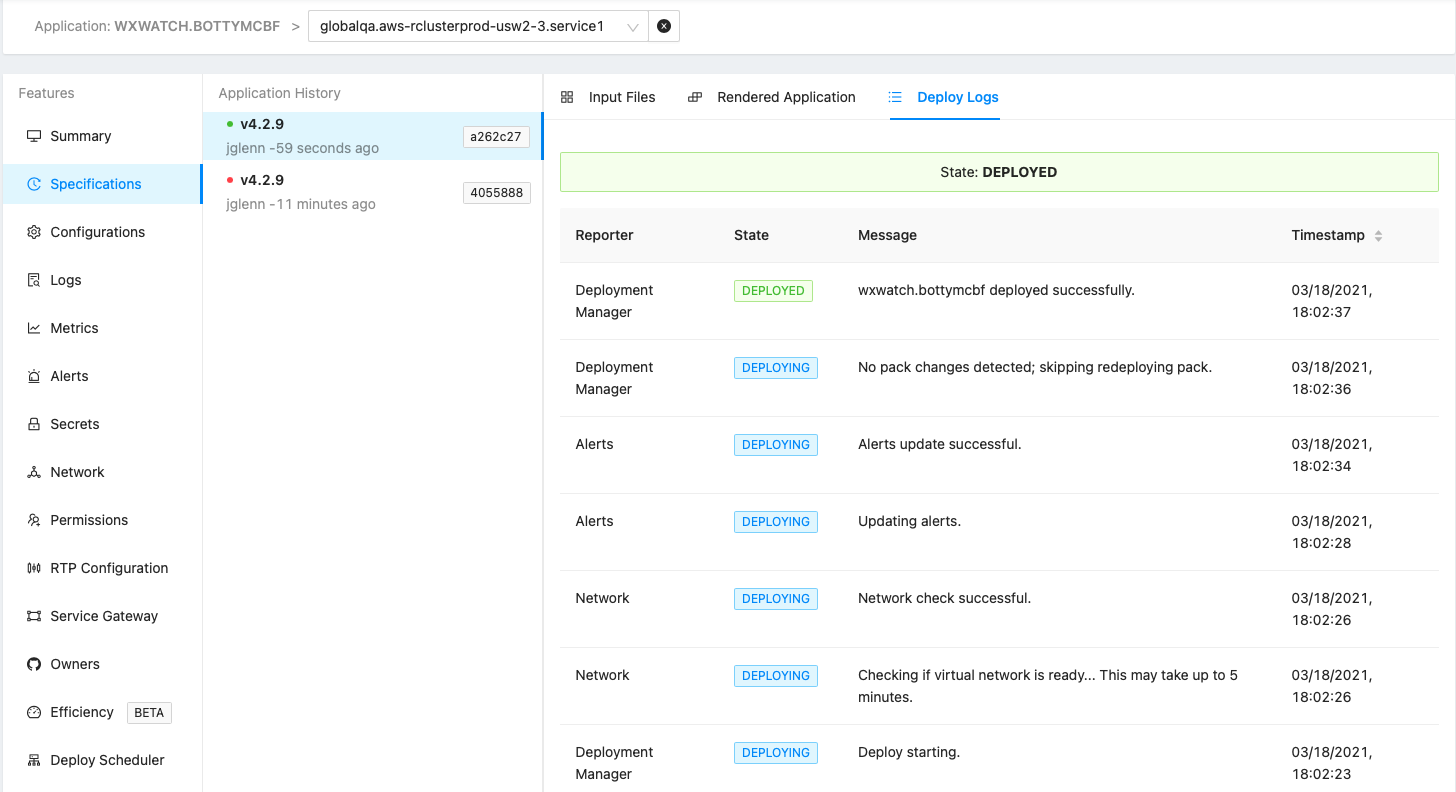
Deployment logs for our service
Where We Are and What’s Next
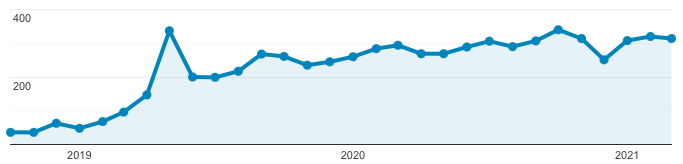
To ensure our investments have paid off, we look at analytics and metrics. When we first launched, Console only had a couple dozen users each month. Now, we’re up to well over 300 engineers per month!
In addition to these metrics, we also conduct periodic surveys and interviews with users to gather direct feedback on the current state of Console. We engage with relevant engineers when we’re considering future features and improvements we have planned. My team wants to make sure we’re always working on the features that teams and engineers need most.
The two themes of Console moving forward will be integrating more teams’ features into Console and correlating the data that Console already has in useful ways.
Here are a few concepts we’re interested in further exploring in the future:
Efficiency Tool
Currently in beta, the Efficiency Tool measures how efficiently a service is using its resources. It uses a combination of CPU, memory, and other usage metrics to give an overall score (out of 100) to a service. This will help teams know if their services are requesting too many resources from the cluster or not. Metrics like these can also help with auto-scaling, load testing, and capacity planning.
Personalization
Console knows who users are (because they have to log in) and which services they’ve looked at recently (so they can quickly navigate back to where they’ve been) but doesn’t do anything else with that data. Personalization, however, could allow Console to immediately show you services that your team owns, any messages, alerts, or other issues that are present, and let a user favorite any services or other entities.
Dependency Correlation
Every service at Riot has services that it depends on and, conversely, services that depend on it. With dependency correlation, Console, in the event of a service with an outage or other issue, could show users of other services within the afflicted service’s dependency chain that there is an active issue. This could assist engineers when triaging their own services, as well as allow operations teams to better understand the effects of issues on other services and products at Riot.
Conclusion
As you can see, Console has become a highly usable one-stop-shop for Riot engineers. Throughout its development we’ve prioritized feedback from engineers and teams across Riot, and as we look to the future, we continue to integrate input from the audience that will use our tools daily. As more teams add features, Console will continue to improve, and we’re invested in ensuring an excellent experience for developers across Riot so they can focus on what they do best.
Thanks for reading! If you have questions or comments, feel free to post them below.